Open Access
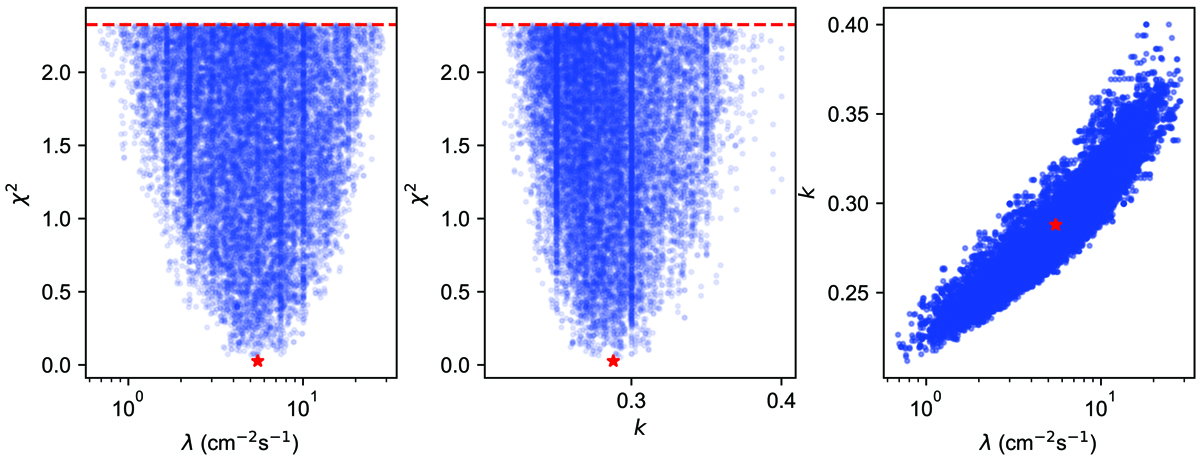
Fig. D.1.
Download original image
Distributions of Weibull parameters λ and k vs. χ2 and parameter correlation plot for F30 fit obtained using GOES SC 24 and terrestrial CI proxy data. Red stars correspond to the best-fit parameter values (![]() ), and blue dots have χ2 ≤
), and blue dots have χ2 ≤ ![]() + 2.30, as shown with the dashed red line.
+ 2.30, as shown with the dashed red line.
Current usage metrics show cumulative count of Article Views (full-text article views including HTML views, PDF and ePub downloads, according to the available data) and Abstracts Views on Vision4Press platform.
Data correspond to usage on the plateform after 2015. The current usage metrics is available 48-96 hours after online publication and is updated daily on week days.
Initial download of the metrics may take a while.