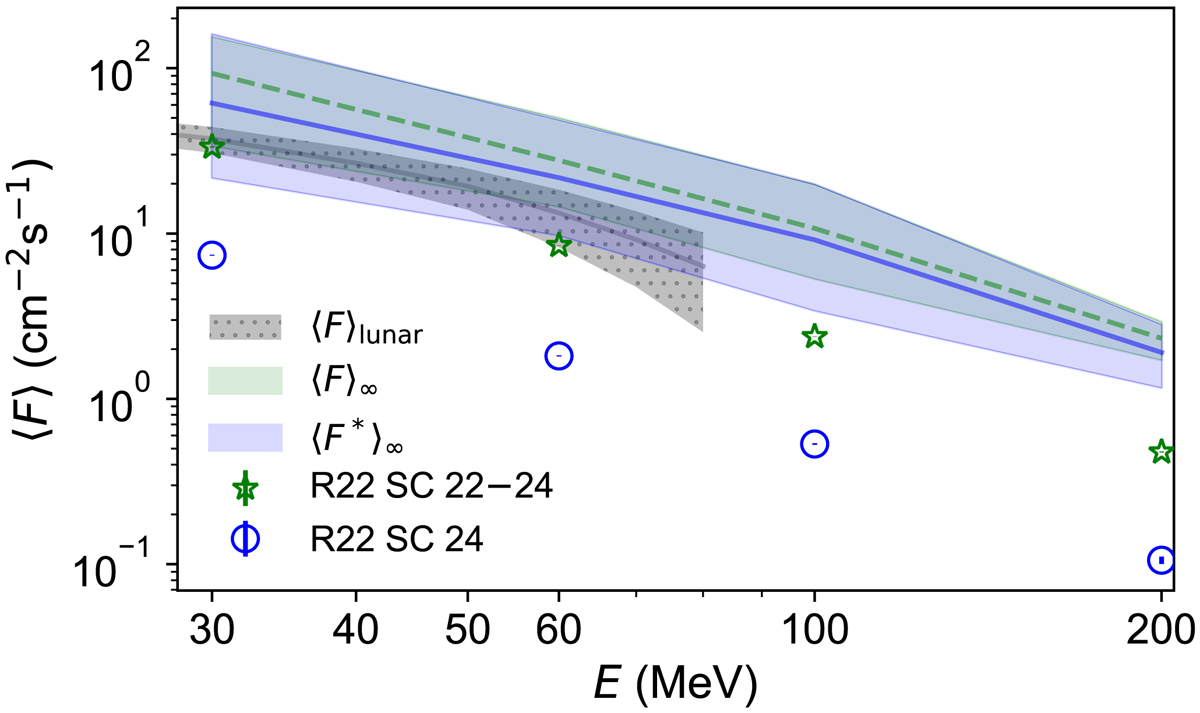
Fig. 3.
Download original image
Energy dependence of the average SEP flux evaluated using different sources: Megayear-averaged flux estimated from lunar data (gray) (Poluianov et al. 2018), ⟨F⟩∞ based on the combined direct and CI-proxy datasets (green; Fig. 1), similar to the green line, including CI-proxy data, but with the direct data for SC 24 alone ⟨F*⟩∞ (blue), directly measured average fluxes for SC 22–24 (green stars) (Raukunen et al. 2022), and the directly measured average fluxes for SC 24 (blue dots) (Raukunen et al. 2022). Uncertainties are for the full range for the lunar data and 68% c.i. for the other reconstructions. The plotted flux values are listed in Table 1.
Current usage metrics show cumulative count of Article Views (full-text article views including HTML views, PDF and ePub downloads, according to the available data) and Abstracts Views on Vision4Press platform.
Data correspond to usage on the plateform after 2015. The current usage metrics is available 48-96 hours after online publication and is updated daily on week days.
Initial download of the metrics may take a while.