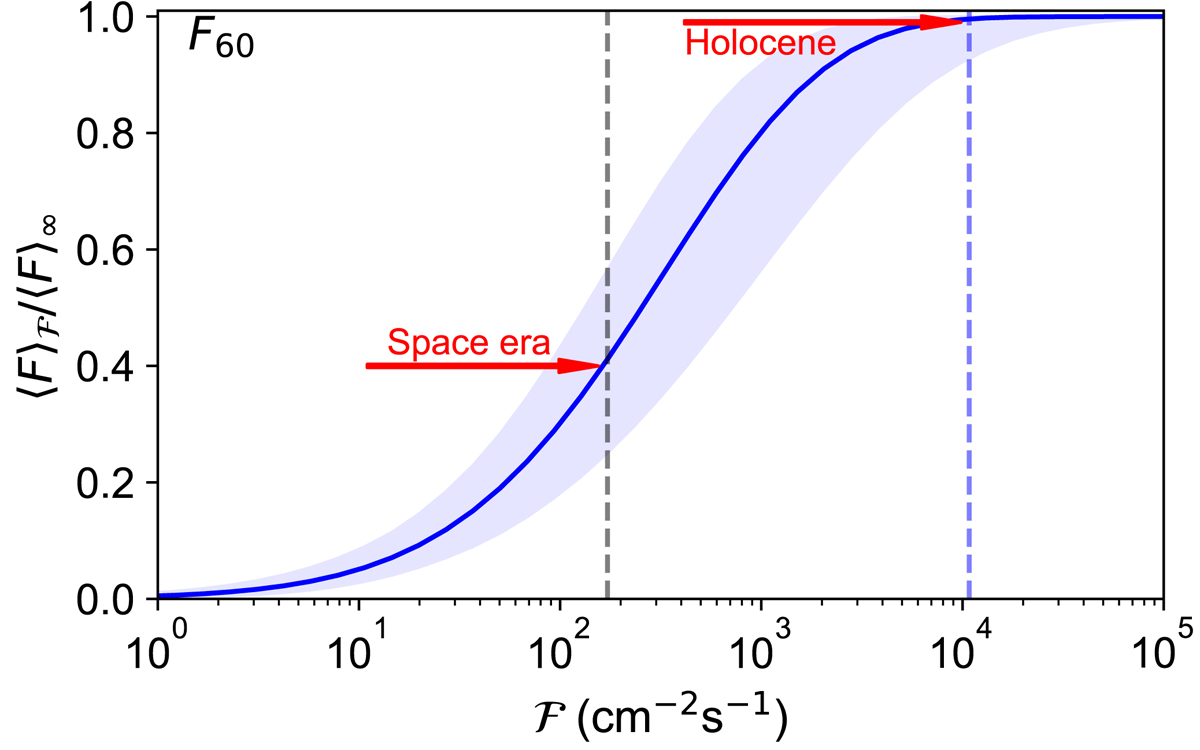
Fig. 2.
Download original image
Ratio ⟨F60⟩ℱ/⟨F60⟩∞ as a function of maximum observed SEP flux ℱ (see Eq. (2)) for the Weibull distribution shown in the RHS block of Table 3. Shading represents the 68% c.i. The vertical dashed lines, black and blue, with the horizontal red arrows, indicate the upper limits of the SEP flux for the space era and Holocene, respectively, i.e., the black dot and blue star in Fig. 1b.
Current usage metrics show cumulative count of Article Views (full-text article views including HTML views, PDF and ePub downloads, according to the available data) and Abstracts Views on Vision4Press platform.
Data correspond to usage on the plateform after 2015. The current usage metrics is available 48-96 hours after online publication and is updated daily on week days.
Initial download of the metrics may take a while.