Fig. 1.
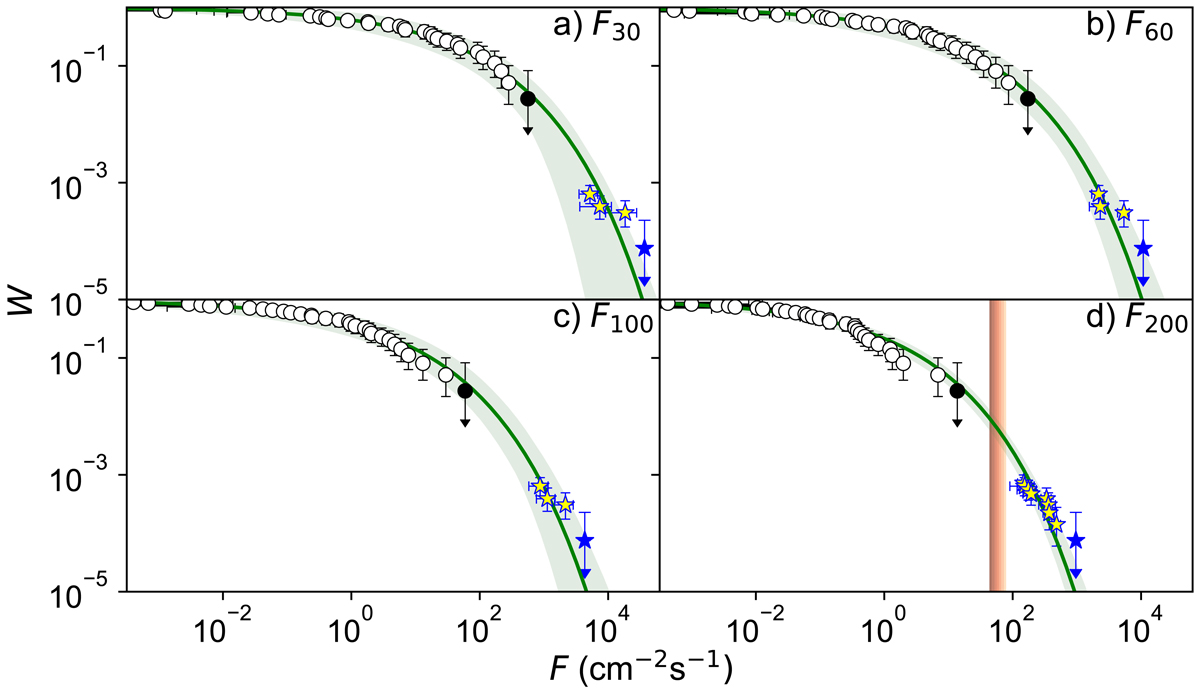
Download original image
CCDF (see text for definition) for SEP flux F30, F60, F100, and F200 in panels a–d, respectively. The uncertainties are evaluated using the Poisson statistics (e.g., Usoskin & Kovaltsov 2012). Open circles correspond to direct measurements (Raukunen et al. 2022), and the black dots depict conservative upper limits (see text). The open and filled blue stars represent the annual flux estimates for ESPEs from terrestrial CI data (Table 2) and the conservative upper limits (Usoskin 2017), respectively. The green curves depict the Weibull distributions fit to the combined direct and terrestrial CI datasets (Sect. 3). All error bars and filled areas bound the 68% c.i. The vertical red bar in panel d indicates the sensitivity threshold of the terrestrial CI method to an ESPE on a 3σ level (Usoskin et al. 2020).
Current usage metrics show cumulative count of Article Views (full-text article views including HTML views, PDF and ePub downloads, according to the available data) and Abstracts Views on Vision4Press platform.
Data correspond to usage on the plateform after 2015. The current usage metrics is available 48-96 hours after online publication and is updated daily on week days.
Initial download of the metrics may take a while.