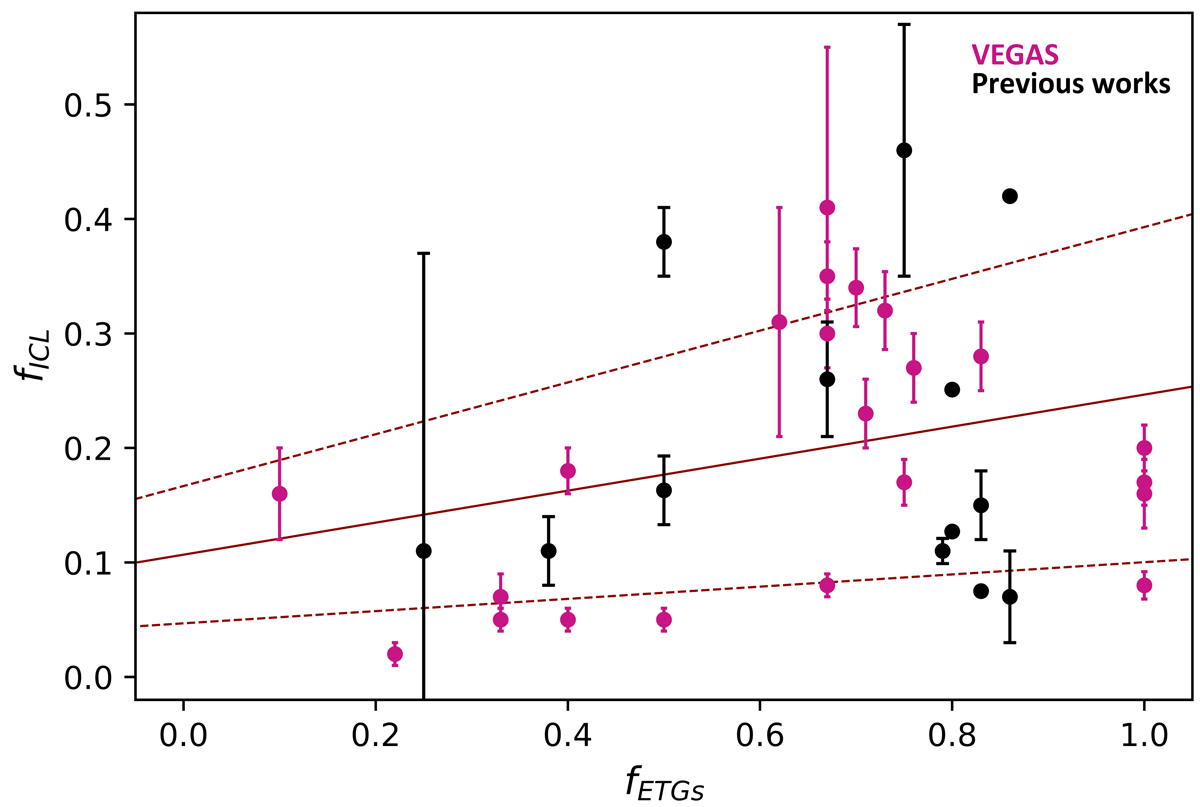
Fig. 3.
Download original image
ICL fraction (fICL) as a function of the fETGs. The values for the ICL obtained from VEGAS are marked in magenta and the other estimates for groups and clusters of galaxies available in the literature in black (same references as in Fig. 2). A weak trend exists between the two quantities, as indicated by the dark-red solid line, which reflects the best fit for the linear correlation. The dashed red lines mark the 1σ significance range of that correlation. The best-fit equation is fICL = (0.14 ± 0.08)*fETGs − (0.11 ± 0.06), with R2 ∼ 10% and p-value = 0.12.
Current usage metrics show cumulative count of Article Views (full-text article views including HTML views, PDF and ePub downloads, according to the available data) and Abstracts Views on Vision4Press platform.
Data correspond to usage on the plateform after 2015. The current usage metrics is available 48-96 hours after online publication and is updated daily on week days.
Initial download of the metrics may take a while.