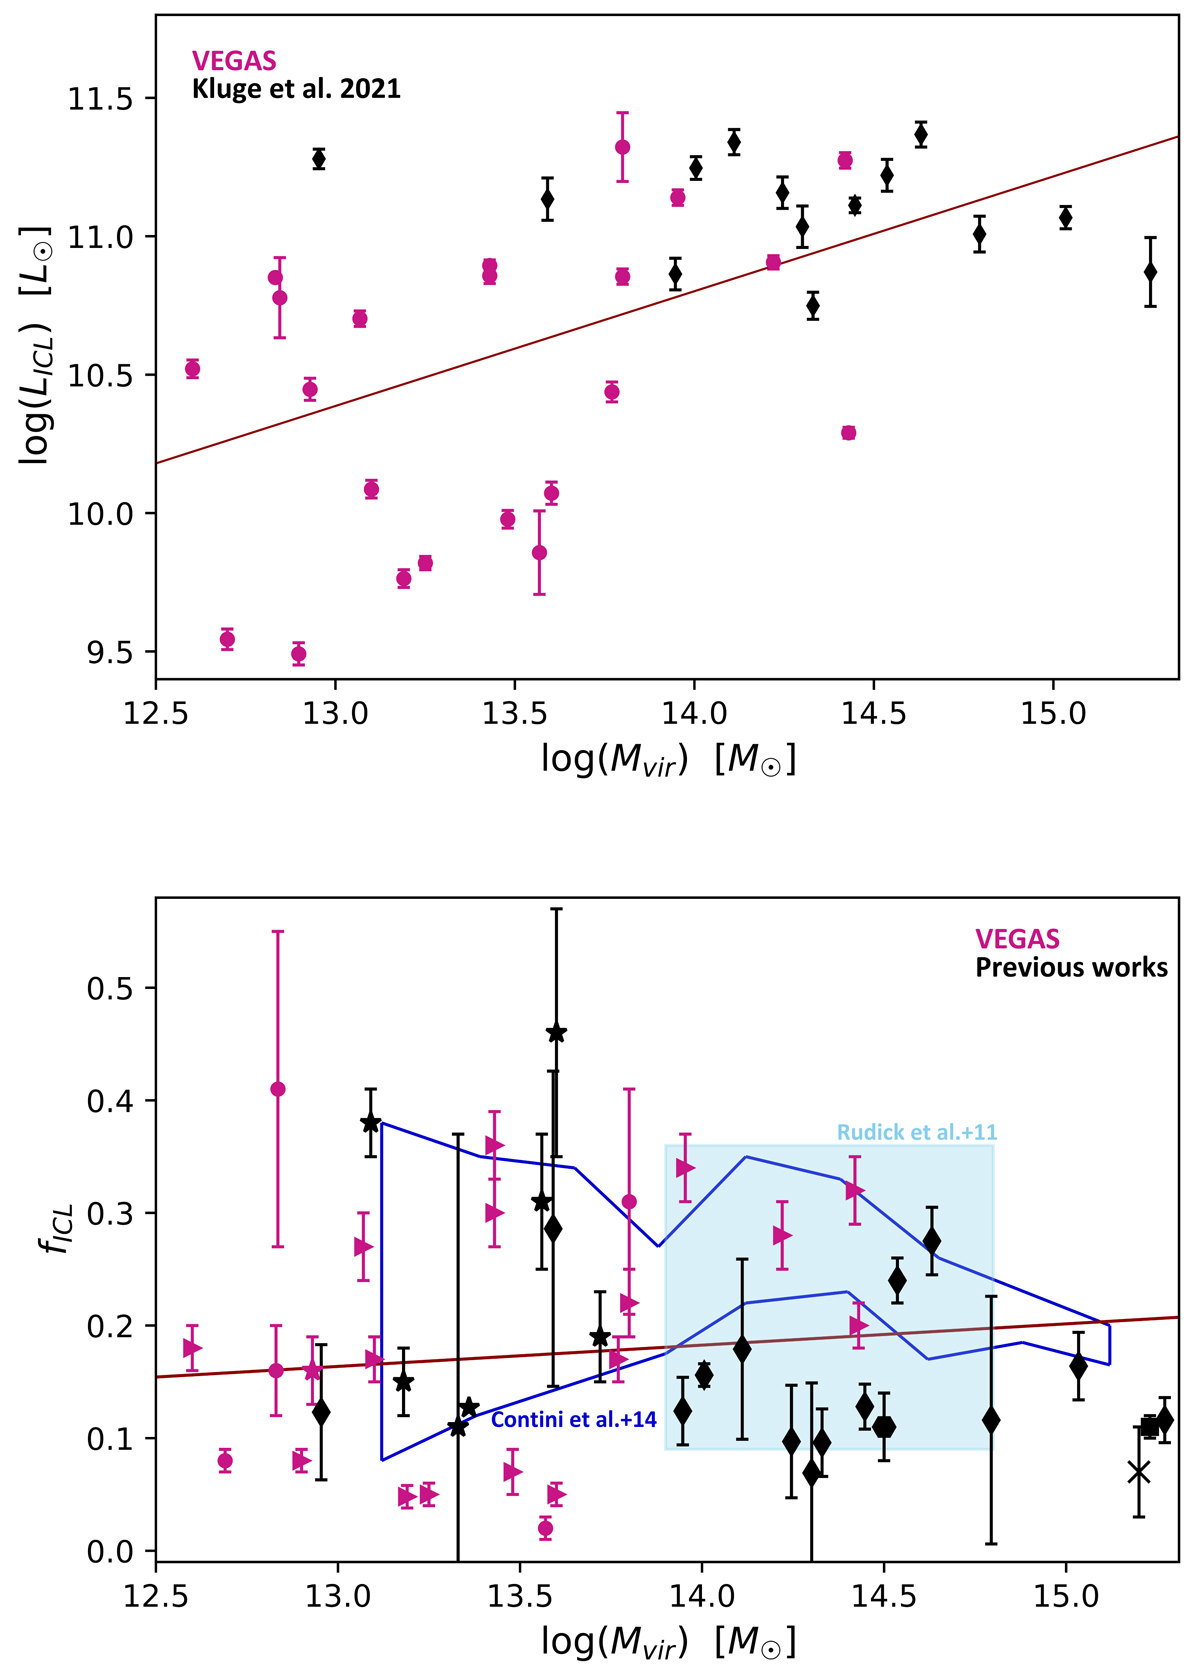
Fig. 2.
Download original image
Relationships between ICL amount as a function of Mvir. Top panel: luminosity of the ICL component as a function of the Mvir. The best fit for the linear correlation is shown by the dark-red solid line. The best fit equation is log(LICL) = (0.41 ± 0.11)*log(Mvir)−(5 ± 1.5), with R2 = 28% and p-value = 0. Lower panel: ICL fraction (fICL) vs. Mvir obtained for the VEGAS targets (magenta symbols), compared with the values of fICL available in the literature, for targets at z ≤ 0.05 (black points). These are the compact groups from Da Rocha & Mendes de Oliveira (2005), Da Rocha et al. (2008), Pildis et al. (1995), Poliakov et al. (2021) Ragusa et al. (2021, stars), the Coma cluster (Jiménez-Teja et al. 2019, octagon), the Virgo cluster (Mihos et al. 2017, cross) and the Abell 85 cluster (Montes et al. 2021, square). The clusters of galaxies from Kluge et al. (2021) are also included in this plot (diamonds). The virial masses for the cluster in the latter sample are from Kluge (2020), when available. For systems with no estimation of the viral mass, we used the velocity dispersion of the member galaxies reported in Kluge (2020) to estimate it following Munari et al. (2013). The solid line indicates the best fit for the linear correlation. The best fit equation is fICL = (0.02 ± 0.02)*log(Mvir)−(0.07 ± 0.34), with R2 = 1.6 % and p-value = 0.47. The theoretical prediction obtained by Contini et al. (2014; blue contours) and Rudick et al. (2011; light blue area) are included for comparison.
Current usage metrics show cumulative count of Article Views (full-text article views including HTML views, PDF and ePub downloads, according to the available data) and Abstracts Views on Vision4Press platform.
Data correspond to usage on the plateform after 2015. The current usage metrics is available 48-96 hours after online publication and is updated daily on week days.
Initial download of the metrics may take a while.