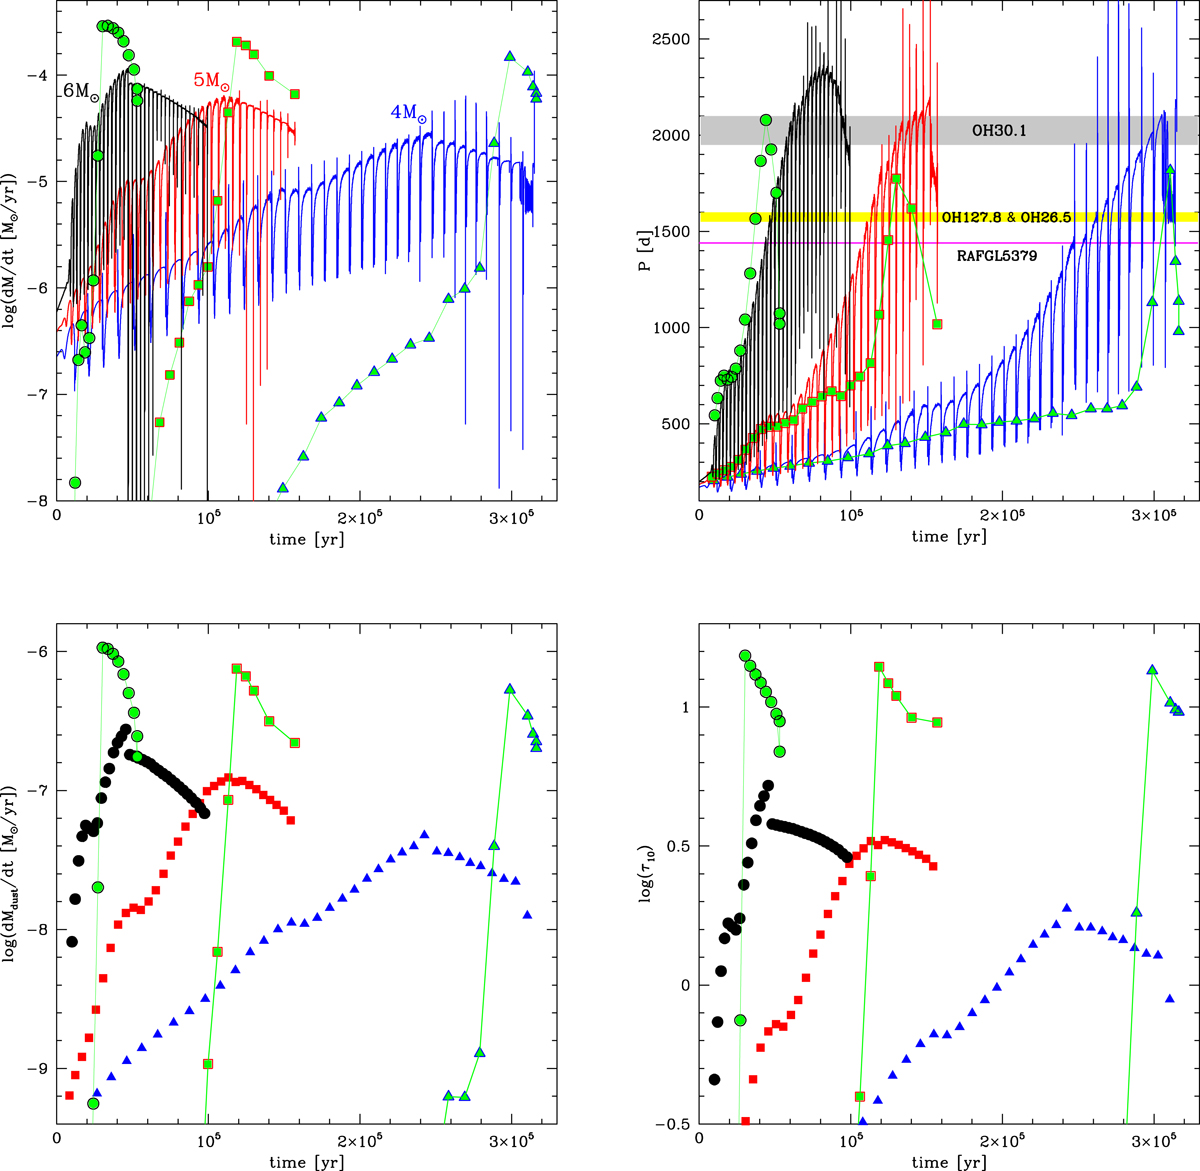
Fig. 5.

Download original image
Time variation of the mass-loss rate (top left panel), pulsation period (top right), dust production rate (bottom left), and optical depth τ10 (bottom right) of model stars with an initial mass of 4 M⊙ (black lines and circles), 5 M⊙ (red lines and squares), and 6 M⊙ (blue lines and triangles), calculated with the mass-loss prescription by Blo95. The points in the bottom panels refer to the values in the middle of each inter-pulse phase. Green points refer to the inter-pulse phases, and indicate results from modelling based on the VW93 description of mass loss, where the value β = 3 was considered for the scattering parameter. The shadings in the top right panel are the same as in Fig. 3.
Current usage metrics show cumulative count of Article Views (full-text article views including HTML views, PDF and ePub downloads, according to the available data) and Abstracts Views on Vision4Press platform.
Data correspond to usage on the plateform after 2015. The current usage metrics is available 48-96 hours after online publication and is updated daily on week days.
Initial download of the metrics may take a while.


