Fig. 6
Download original image
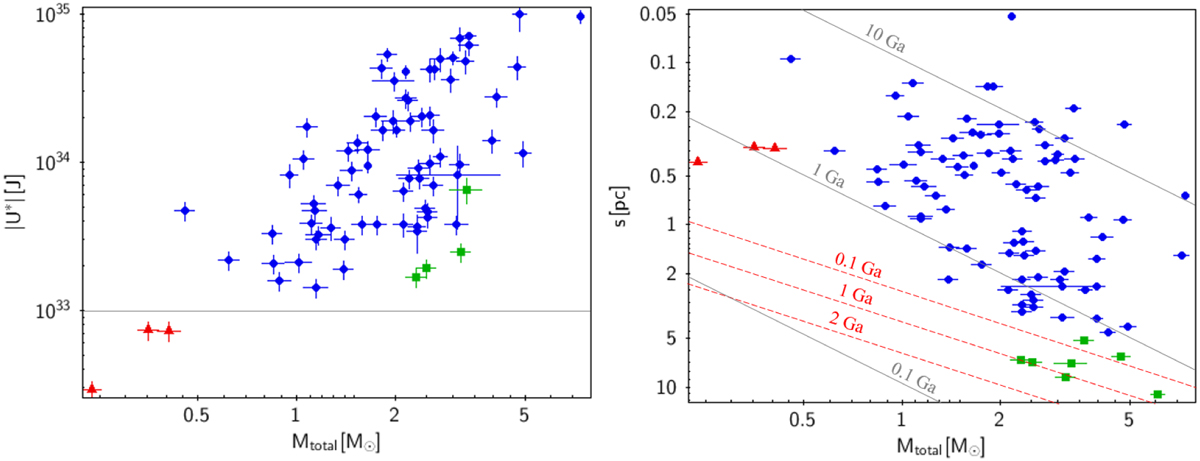
Reduced binding energy (left) and projected physical separation (right) as functions of ultrawide system total mass. In both panels, the three most fragile systems (top of Table 5) and the most separated systems (bottom of Table 5) are plotted in red triangles and green squares, respectively, while the rest of investigated ultrawide systems are plotted in blue circles. The error bars in s are smaller than the used symbols. In the left panel, the horizontal line marks the limit of ![]() at 1033 J. In the right panel, the grey solid diagonal lines mark the statistical maximum ages of 0.1, 1, and 10 Ga at which the systems are likely bound (computed with Eq. (9)), while the red dashed diagonal lines mark the corresponding orbital periods of 0.1, 1, and 2 Ga (computed with Kepler’s third law). In both cases we used the correction a ≈ 1.26 s (Fischer & Marcy 1992).
at 1033 J. In the right panel, the grey solid diagonal lines mark the statistical maximum ages of 0.1, 1, and 10 Ga at which the systems are likely bound (computed with Eq. (9)), while the red dashed diagonal lines mark the corresponding orbital periods of 0.1, 1, and 2 Ga (computed with Kepler’s third law). In both cases we used the correction a ≈ 1.26 s (Fischer & Marcy 1992).
Current usage metrics show cumulative count of Article Views (full-text article views including HTML views, PDF and ePub downloads, according to the available data) and Abstracts Views on Vision4Press platform.
Data correspond to usage on the plateform after 2015. The current usage metrics is available 48-96 hours after online publication and is updated daily on week days.
Initial download of the metrics may take a while.