Fig. 3
Download original image
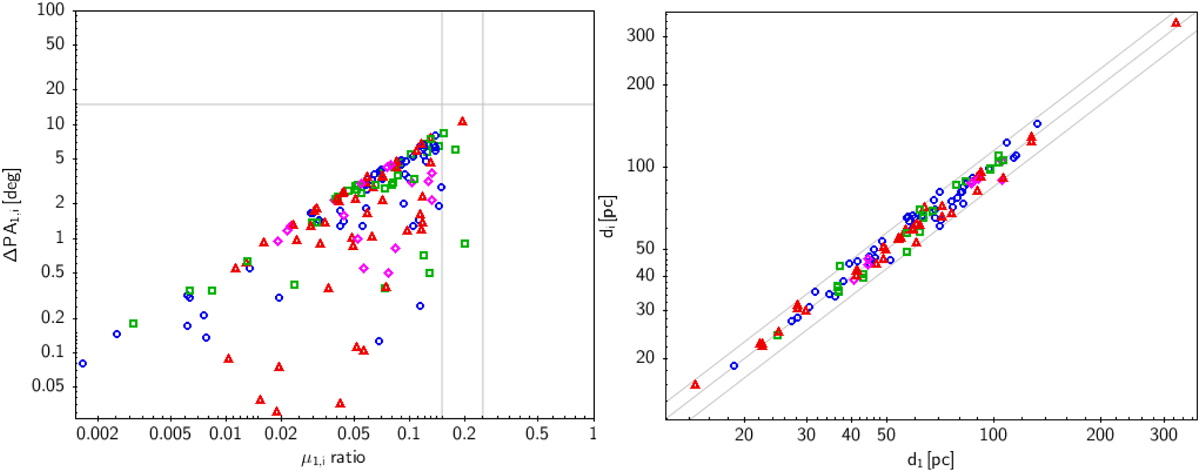
Astrometric criteria for pair validation. In both diagrams, we plot pairs between primaries and secondaries with blue circles, tertiaries with red triangles, quaternaries with green squares, and higher order companions with purple diamonds. Left: ΔPA1,i vs. µ1,i ratio diagram. Vertical and horizontal grey lines mark the µ ratios of 0.15 and 0.25 µ and ΔPA of 15 deg, respectively. Compare with Fig. 2 in Montes et al. (2018). Right: distance of companions vs. distance of primaries. Diagonal lines indicate the 1.15:1, 1:1, and 0.85:1 distance relationships. The α Cen AB + Proxima system, at d ~ 1.3 pc, is not shown.
Current usage metrics show cumulative count of Article Views (full-text article views including HTML views, PDF and ePub downloads, according to the available data) and Abstracts Views on Vision4Press platform.
Data correspond to usage on the plateform after 2015. The current usage metrics is available 48-96 hours after online publication and is updated daily on week days.
Initial download of the metrics may take a while.