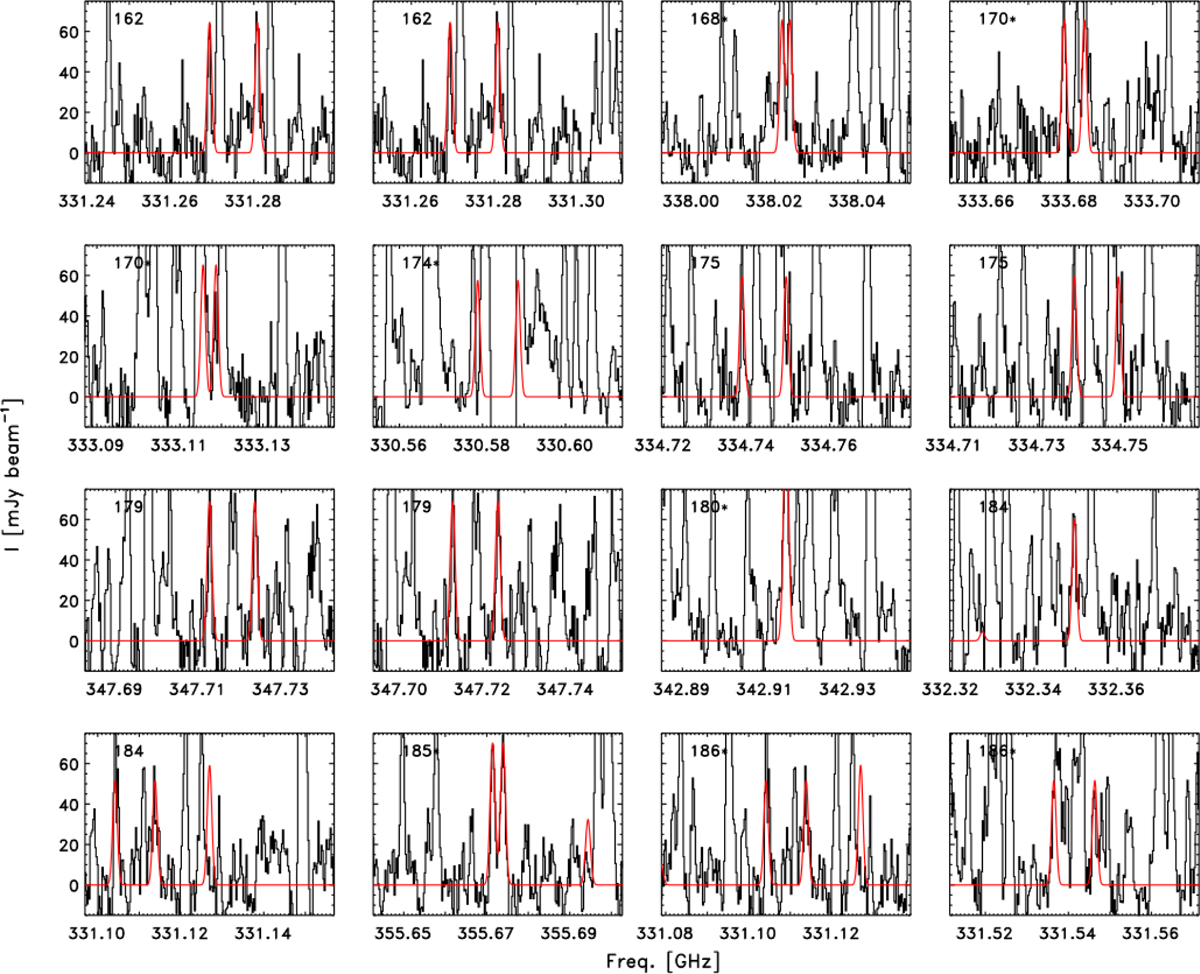
Fig. A.1
Download original image
68 transitions of CHD2CHO predicted to be the brightest assuming a rotational temperature of 125 K. The red line indicates the predicted line intensities obtained by fitting to the lines with the synthetic spectra, thereby constraining the column density. In each panel, the numbers on the upper left corner indicate the excitation temperature Tex of the fitted transitions. An asterisk next to this number indicates situations where two lines from Table A.1 with similar values for Eu fall within 10 MHz of each other and are shown together in one panel.
Current usage metrics show cumulative count of Article Views (full-text article views including HTML views, PDF and ePub downloads, according to the available data) and Abstracts Views on Vision4Press platform.
Data correspond to usage on the plateform after 2015. The current usage metrics is available 48-96 hours after online publication and is updated daily on week days.
Initial download of the metrics may take a while.