Open Access
Fig. 1.
Download original image
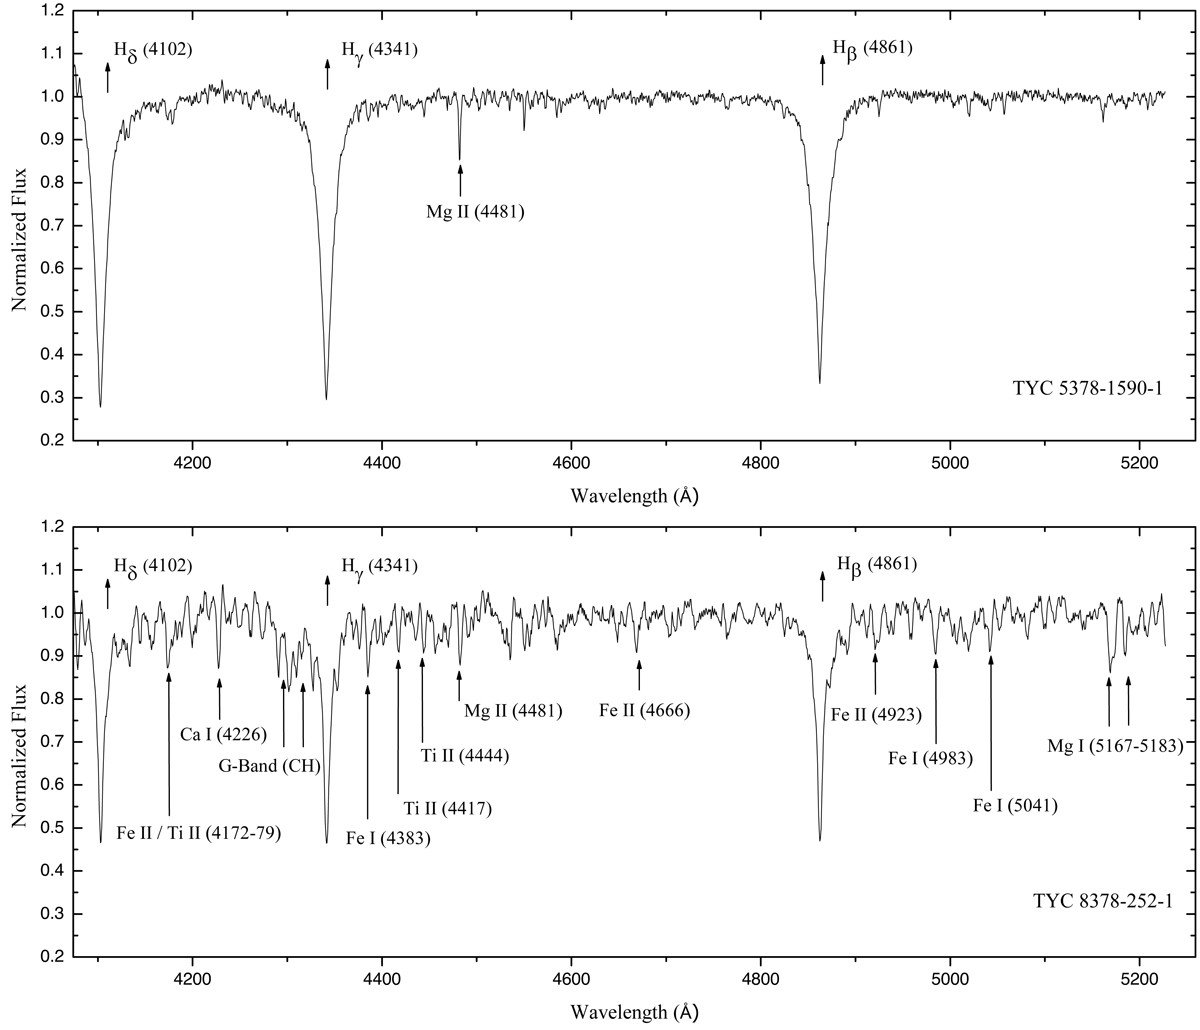
Sample spectra for TYC 5378-1590-1 (upper diagram, for phase 0.56) and TYC 8378-252-1 (lower diagram, for phase 0.01) obtained in this study. While the hydrogen Balmer lines and the Mg II (4481) line are indicated in the spectrum of TYC 5378-1590-1, many metallic lines are also indicated in the spectrum of TYC 8378-252-1.
Current usage metrics show cumulative count of Article Views (full-text article views including HTML views, PDF and ePub downloads, according to the available data) and Abstracts Views on Vision4Press platform.
Data correspond to usage on the plateform after 2015. The current usage metrics is available 48-96 hours after online publication and is updated daily on week days.
Initial download of the metrics may take a while.