Fig. A.3.
Download original image
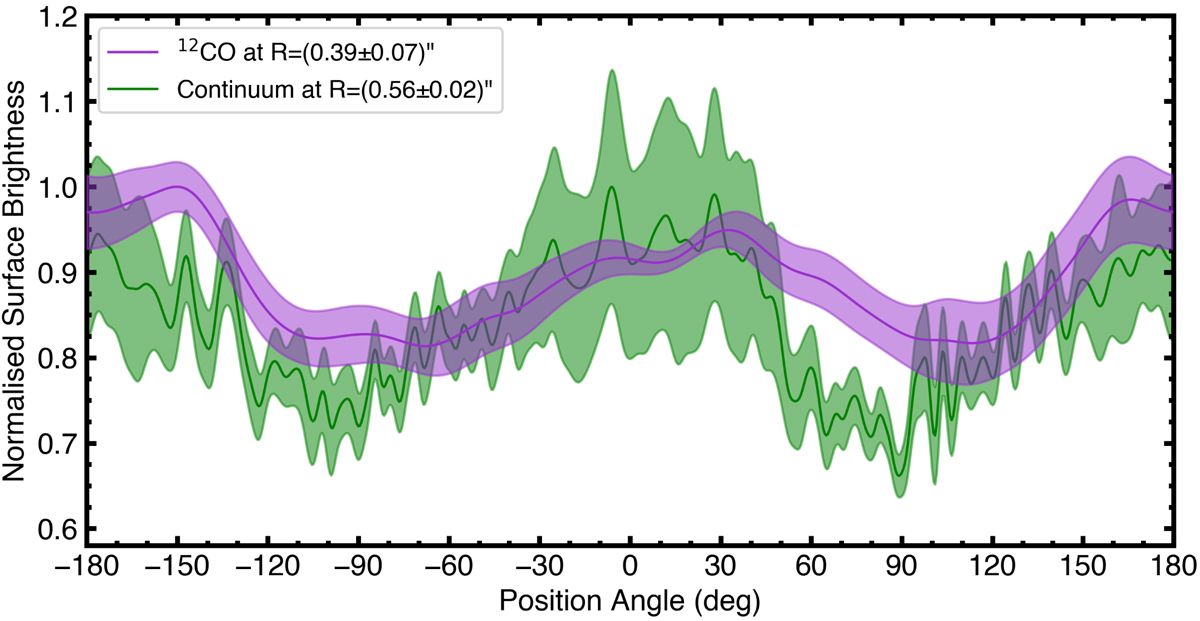
Azimuthal profiles of the surface brightness, normalized to the peak of the emission. Profiles were extracted at an annulus with a width of approximately one corresponding beam size centered at 0.56″ and 0.39″ for the 231 GHz continuum and the CO peak flux, which both show significant azimuthal intensity variations, of 34% and 19%, respectively. Shaded regions show the standard deviation of each radial average.
Current usage metrics show cumulative count of Article Views (full-text article views including HTML views, PDF and ePub downloads, according to the available data) and Abstracts Views on Vision4Press platform.
Data correspond to usage on the plateform after 2015. The current usage metrics is available 48-96 hours after online publication and is updated daily on week days.
Initial download of the metrics may take a while.