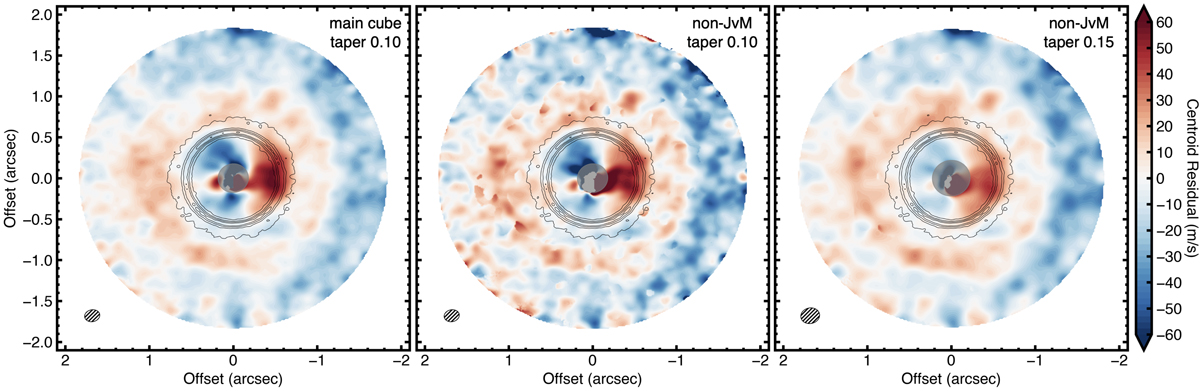
Fig. A.7.
Download original image
Comparison of the velocity residual maps for different imaging parameters. The left panel corresponds to the cube used in the main text, while the middle panel corresponds to the same cube without JvM correction. The right panel shows the residual maps for a non-JvM-corrected cube with a different taper (0.15″). In all panels the dust continuum is overlaid in solid contours with equal levels, as in Fig. 1. Best-fit Keplerian models were subtracted from each of the cubes. The detection of the non-Keplerian features is quite robust, irrespective of the imaging procedure.
Current usage metrics show cumulative count of Article Views (full-text article views including HTML views, PDF and ePub downloads, according to the available data) and Abstracts Views on Vision4Press platform.
Data correspond to usage on the plateform after 2015. The current usage metrics is available 48-96 hours after online publication and is updated daily on week days.
Initial download of the metrics may take a while.