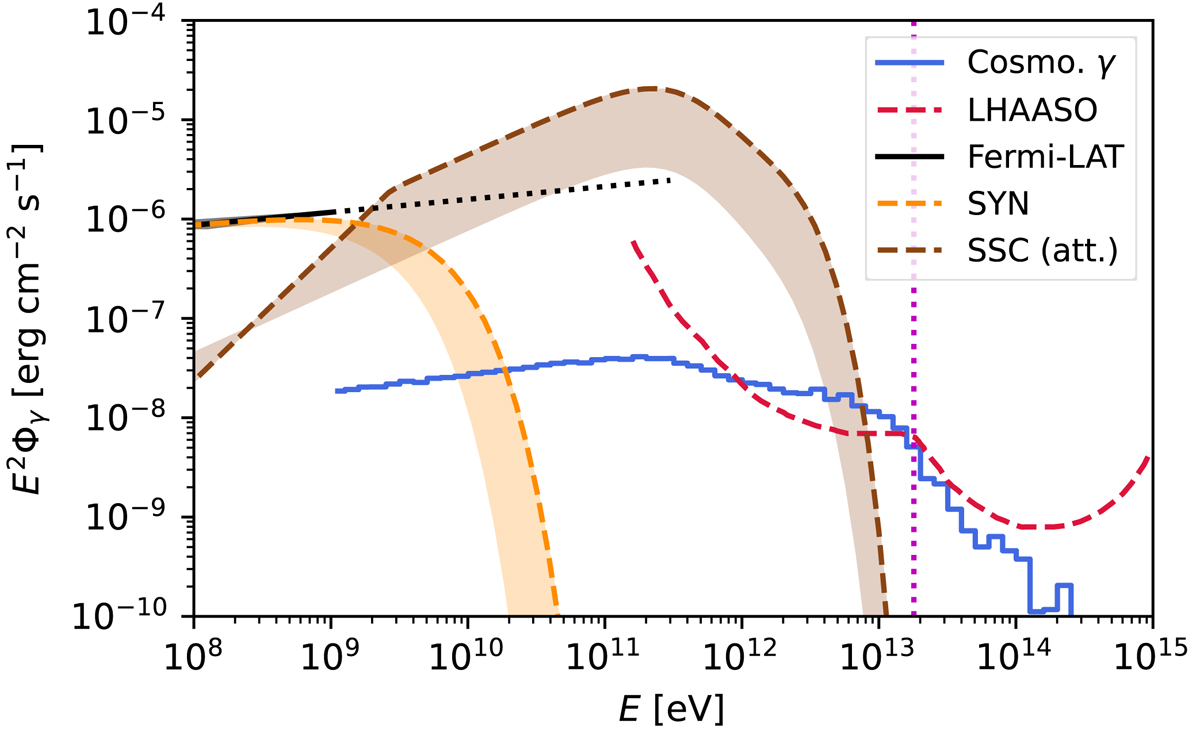
Fig. 2.
Download original image
Line-of-sight cosmogenic γ-ray flux from UHECR interactions (blue curve). The solid black line corresponds to the Fermi-LAT preliminary flux estimate for GRB 221009A (Pillera et al. 2022). The dashed red curve indicates the LHAASO sensitivity corresponding to 2000 s of observation. The vertical dotted line corresponds to the highest-energy detection by LHAASO. The synchrotron and SSC emission components are shown as dashed orange and brown curves, respectively.
Current usage metrics show cumulative count of Article Views (full-text article views including HTML views, PDF and ePub downloads, according to the available data) and Abstracts Views on Vision4Press platform.
Data correspond to usage on the plateform after 2015. The current usage metrics is available 48-96 hours after online publication and is updated daily on week days.
Initial download of the metrics may take a while.