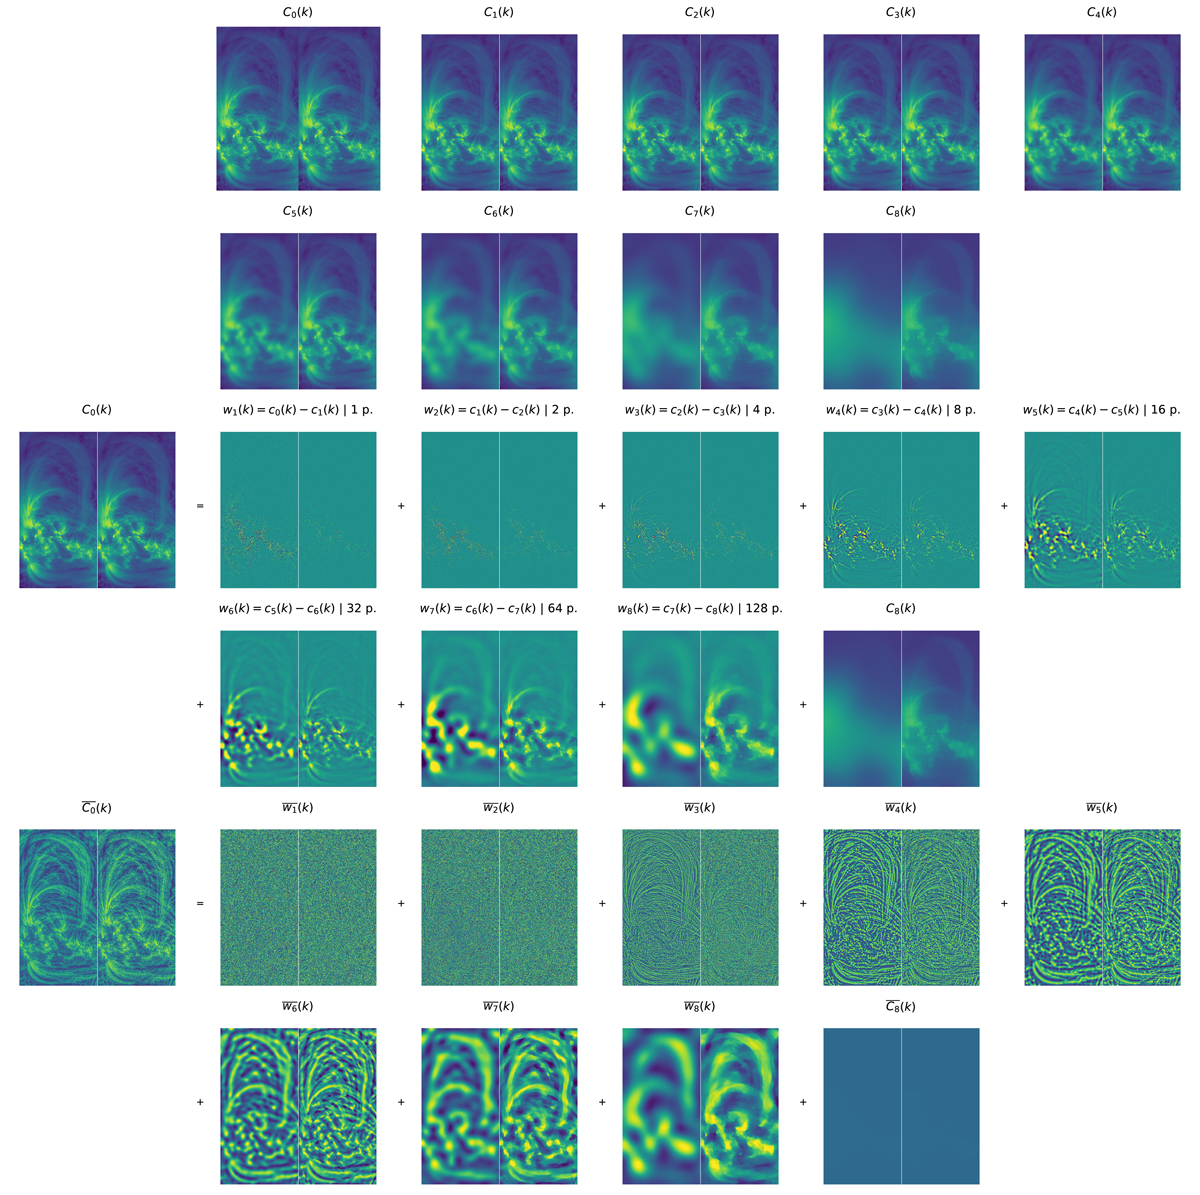
Fig. 2.
Download original image
À trous wavelet transform and coefficients whitening. Two top rows: chained convolutions cs(k) of the input image c0(k) with à trous kernels dilated by a factor of two at each step. The left half of each panel corresponds to regular convolutions; the right half to bilateral filtering. Two middle rows: corresponding wavelet coefficients ws + 1(k)=cs(k)−cs + 1(k), that is the difference between successive convolutions or bilateral filterings. The last coefficient is the result of the last convolution or bilateral filtering. The original image (c0(k), left) is the sum of all coefficients. The bilateral transform preserves the edges in the coarse images (top rows). Two bottom rows: whitened coefficients, i.e., normalized to the local power. The filtered image (left) is the sum of all whitened coefficients. For visualization purposes, the convolutions and the coefficients are displayed using two different color scales.
Current usage metrics show cumulative count of Article Views (full-text article views including HTML views, PDF and ePub downloads, according to the available data) and Abstracts Views on Vision4Press platform.
Data correspond to usage on the plateform after 2015. The current usage metrics is available 48-96 hours after online publication and is updated daily on week days.
Initial download of the metrics may take a while.