Fig. 5
Download original image
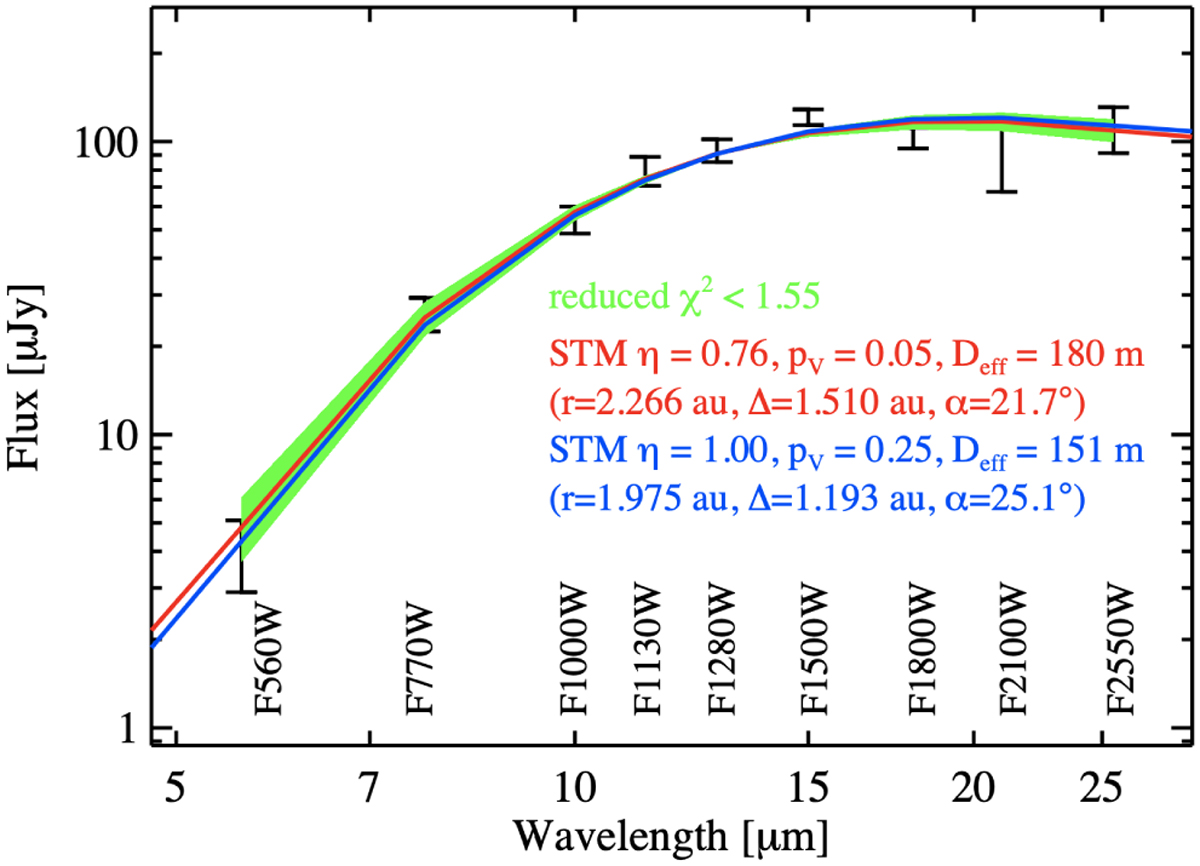
Extracted MIRI fluxes for the new object, shown together with STM predictions for two different η-values, which also correspond to different best-fit r, ∆, α observing geometries. The red line shows the η = 0.756 (pV = 0.05, Deff =km), the blue line the η = 1.0 (pV = 0.25, Deff = km) STM solution, and the green envelope all orbit solutions with χ2 < 1.55. The flux scale is given in μJy.
Current usage metrics show cumulative count of Article Views (full-text article views including HTML views, PDF and ePub downloads, according to the available data) and Abstracts Views on Vision4Press platform.
Data correspond to usage on the plateform after 2015. The current usage metrics is available 48-96 hours after online publication and is updated daily on week days.
Initial download of the metrics may take a while.