Open Access
Fig. 6.
Download original image
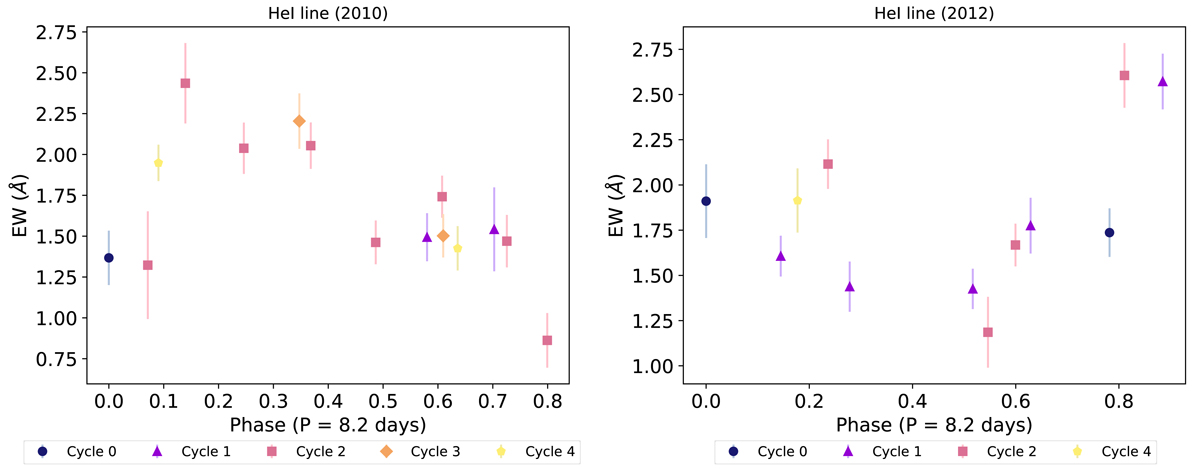
Equivalent width (in Å) of the HeI emission line over time, shown folded in phase with an 8.2 day period, for the 2010 (left panel) and 2012 (right panel) datasets. Different colors and symbols represent different rotation cycles.
Current usage metrics show cumulative count of Article Views (full-text article views including HTML views, PDF and ePub downloads, according to the available data) and Abstracts Views on Vision4Press platform.
Data correspond to usage on the plateform after 2015. The current usage metrics is available 48-96 hours after online publication and is updated daily on week days.
Initial download of the metrics may take a while.