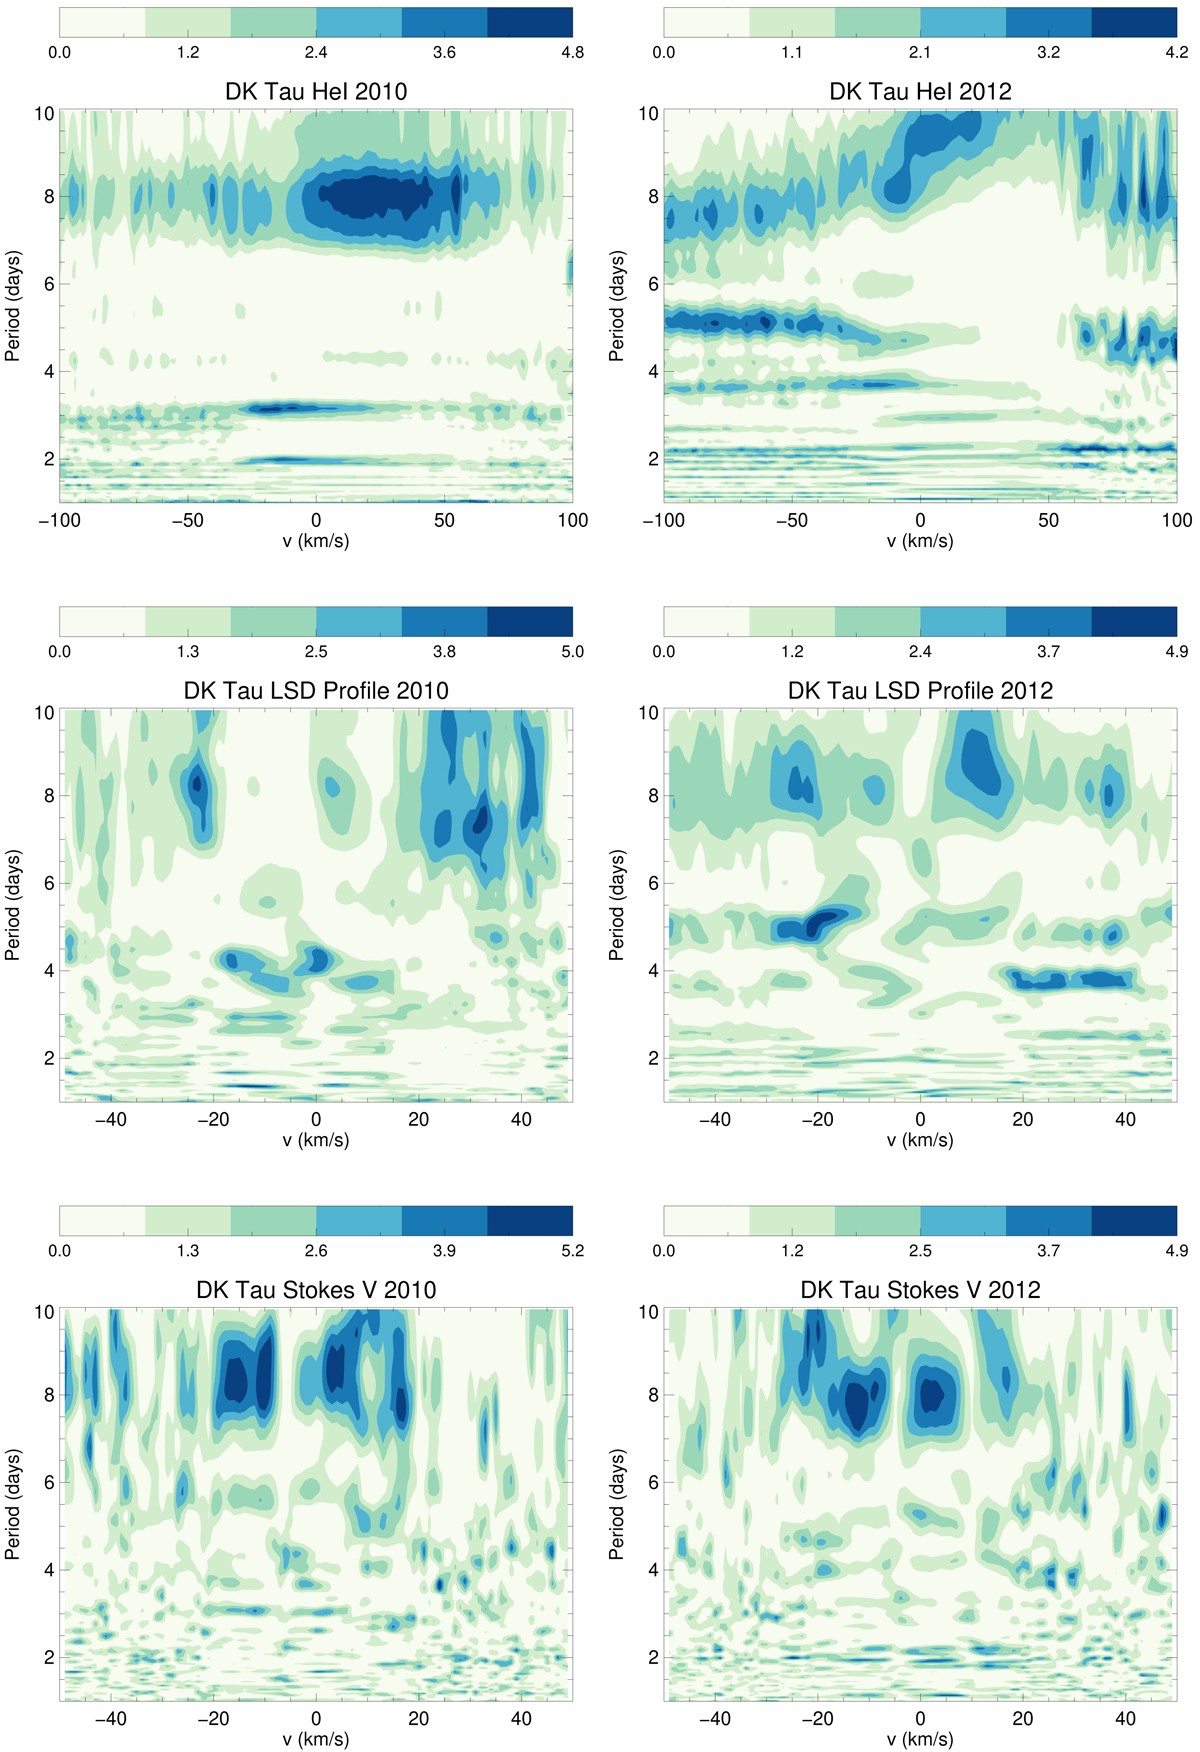
Fig. D.1.
Download original image
Bidimensional periodograms of the intensity of the HeI (at 587.6 nm) emission line (top panel), the Stokes I (middle panel) and Stokes V LSD profiles (bottom panel) of the photospheric absorption lines, for the 2010 (left panels) and 2012 epoch (right panels). The power of the periodogram is showed using the color code. A light color represents a zero power intensity, while a dark color represents the maximum power intensity.
Current usage metrics show cumulative count of Article Views (full-text article views including HTML views, PDF and ePub downloads, according to the available data) and Abstracts Views on Vision4Press platform.
Data correspond to usage on the plateform after 2015. The current usage metrics is available 48-96 hours after online publication and is updated daily on week days.
Initial download of the metrics may take a while.