Open Access
Fig. C.1.
Download original image
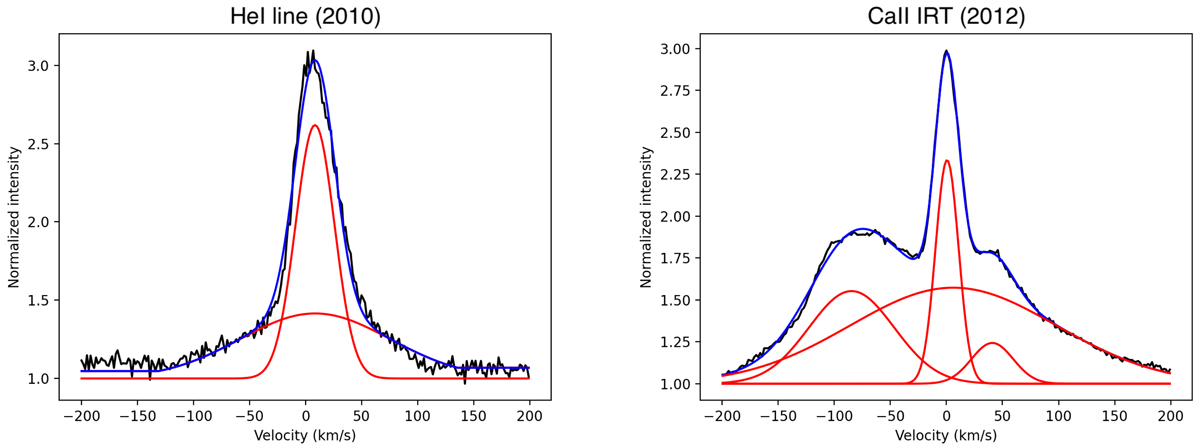
Fit of the HeI line for the first night of the 2010 ESPaDOnS observations (left panel) and of the average of the CaII IRT for the second night of the 2012 ESPaDOnS observations (right panel). The observed line is in black. The different components are in red and their sum is in blue.
Current usage metrics show cumulative count of Article Views (full-text article views including HTML views, PDF and ePub downloads, according to the available data) and Abstracts Views on Vision4Press platform.
Data correspond to usage on the plateform after 2015. The current usage metrics is available 48-96 hours after online publication and is updated daily on week days.
Initial download of the metrics may take a while.