Fig. 5
Download original image
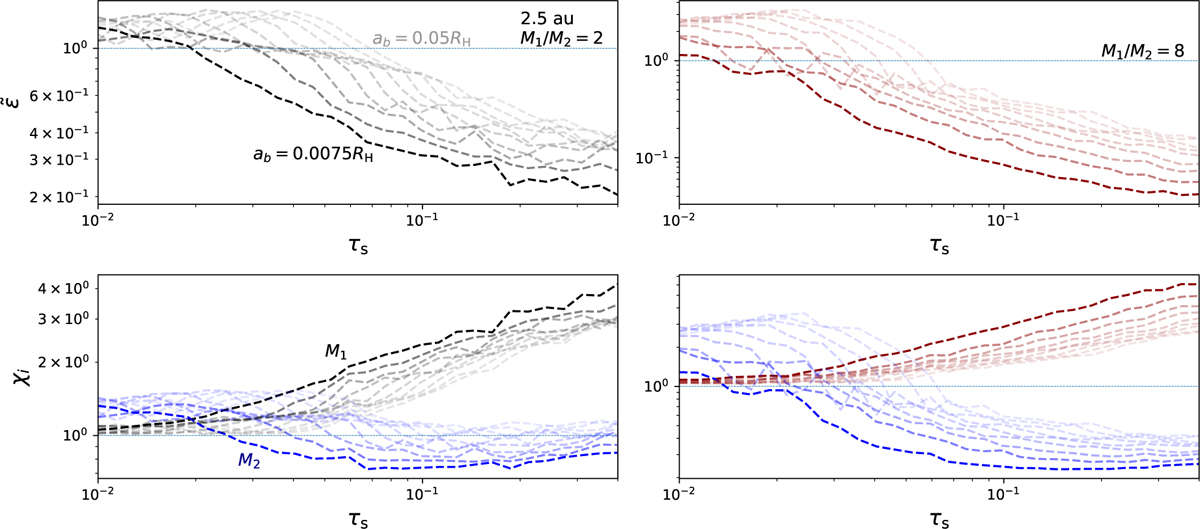
Normalised growth ratios expressed in ![]() (as described in Eq. (21)) for a range of Stokes numbers τs, mass-ratios, and binary separation, ab, at orbital distance of r0 = 2.5 au from the central star, shown at the top. The most opaque lines denote an orbital separation of ab = 0.0075RΗ, while the most transparent lines show an orbital separation of ab = 0.05RH; other lines indicate orbital separations going logarithmically in between. Relative growth timescales of both bodies as a fraction of the growth timescale of a single body with mass, M = M1 + M2 (as described in Eqs. (25) and (26)), shown at the bottom. Black and red lines denote M1, while the blue lines denote M2.
(as described in Eq. (21)) for a range of Stokes numbers τs, mass-ratios, and binary separation, ab, at orbital distance of r0 = 2.5 au from the central star, shown at the top. The most opaque lines denote an orbital separation of ab = 0.0075RΗ, while the most transparent lines show an orbital separation of ab = 0.05RH; other lines indicate orbital separations going logarithmically in between. Relative growth timescales of both bodies as a fraction of the growth timescale of a single body with mass, M = M1 + M2 (as described in Eqs. (25) and (26)), shown at the bottom. Black and red lines denote M1, while the blue lines denote M2.
Current usage metrics show cumulative count of Article Views (full-text article views including HTML views, PDF and ePub downloads, according to the available data) and Abstracts Views on Vision4Press platform.
Data correspond to usage on the plateform after 2015. The current usage metrics is available 48-96 hours after online publication and is updated daily on week days.
Initial download of the metrics may take a while.