Open Access
Fig. 8.
Download original image
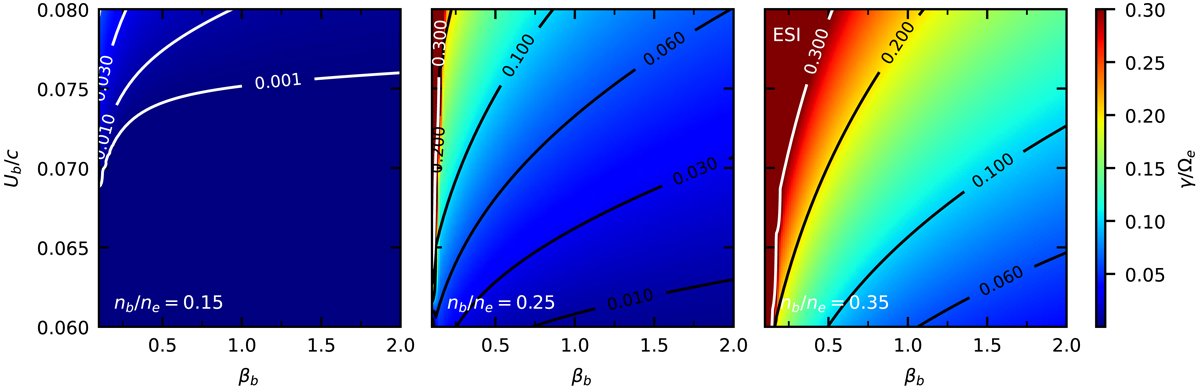
Maximum growth rates γmax/Ωe (color coded) obtained for BEFI for α0 = αb (cases 1), and different density ratios nb/ne = 0.15 (left), nb/ne = 0.25 (center), and nb/ne = 0.35 (right). Levels above contours at γmax/Ωe = 0.3 correspond to the ESI (middle and right panels).
Current usage metrics show cumulative count of Article Views (full-text article views including HTML views, PDF and ePub downloads, according to the available data) and Abstracts Views on Vision4Press platform.
Data correspond to usage on the plateform after 2015. The current usage metrics is available 48-96 hours after online publication and is updated daily on week days.
Initial download of the metrics may take a while.