Fig. 9.
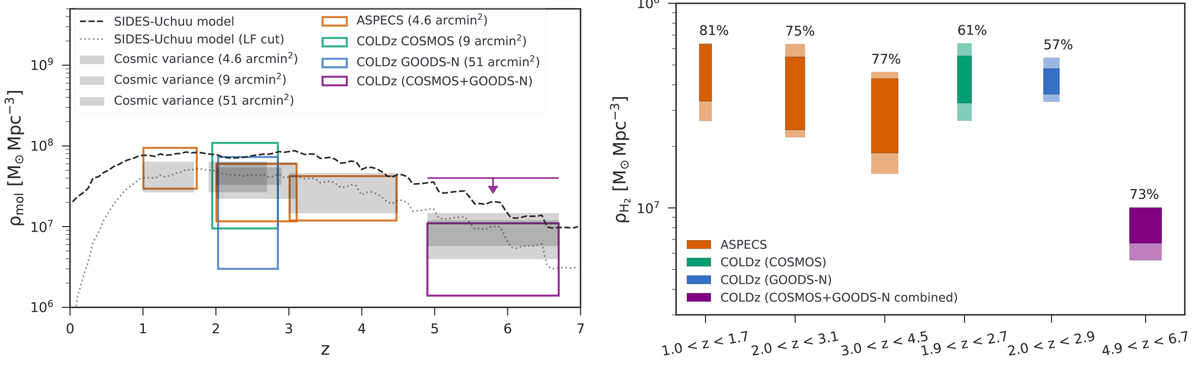
Download original image
Field-to-field variance of the molecular gas mass density, ρH2, at several redshift slices where observational data are available. Left: evolution of ρH2 with redshift. The empty boxes are the observational data from ASPECS (Decarli et al. 2020) and COLDz (Riechers et al. 2019). We also include the upper limit offered by COLDz assuming that all the galaxies could be CO(2–1) emitters at high z. The black dashed line is the SIDES model without a luminosity cut and the black dotted line is the SIDES model with a luminosity cut at ∼5 × 10⁹ K km s−1 pc2. The steps in both lines are caused by the selected redshift grid that the cosmological simulation snapshots were taken. The shaded gray areas correspond to the ρH2 field-to-field variance which has been computed for the same redshift ranges and sizes as the corresponding surveys. Right: field-to-field variance in the molecular gas density in different redshift bins. The light-colored areas show the total field-to-field variance introduced in the molecular gas density estimates, while the dark-colored areas show the Poisson-only variance. The contribution of the latter to the total variance is given as a percentage on top of each rectangle. The different colors indicate the different surveys, hence different size and redshift slice.
Current usage metrics show cumulative count of Article Views (full-text article views including HTML views, PDF and ePub downloads, according to the available data) and Abstracts Views on Vision4Press platform.
Data correspond to usage on the plateform after 2015. The current usage metrics is available 48-96 hours after online publication and is updated daily on week days.
Initial download of the metrics may take a while.