Open Access
Fig. 8.
Download original image
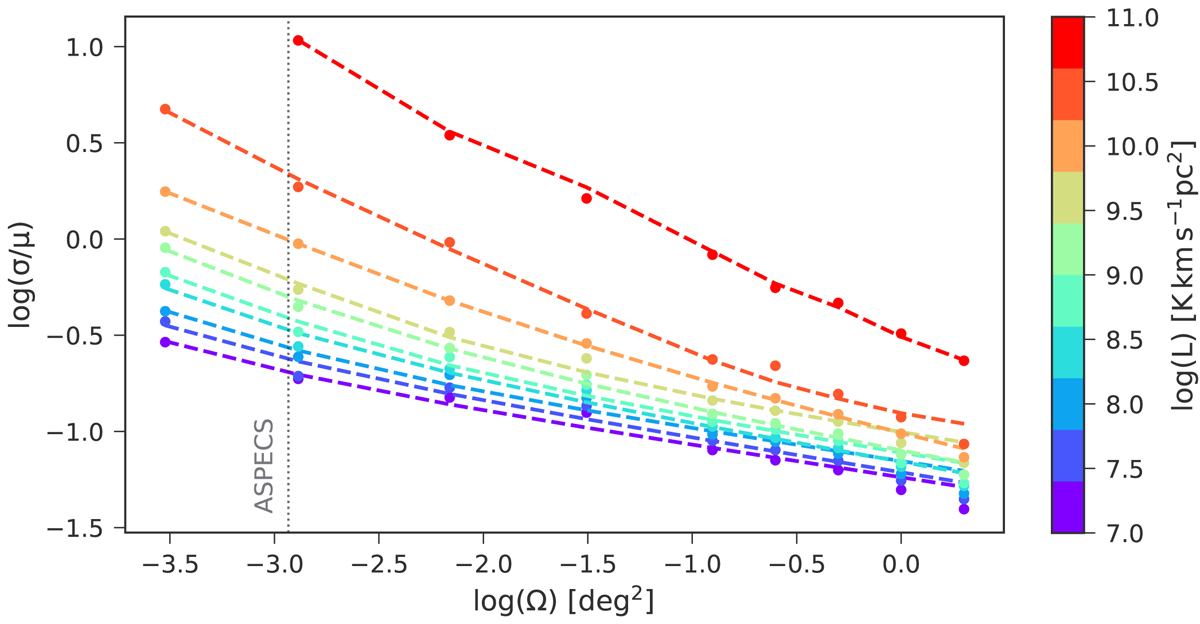
Dependence of the total relative variance of the CO(2–1) LF on the survey size. In different colors we show the different luminosity bins of 0.4 dex size. The points are computed from the SIDES simulations and the dashed lines correspond to the model described by Eq. (5).
Current usage metrics show cumulative count of Article Views (full-text article views including HTML views, PDF and ePub downloads, according to the available data) and Abstracts Views on Vision4Press platform.
Data correspond to usage on the plateform after 2015. The current usage metrics is available 48-96 hours after online publication and is updated daily on week days.
Initial download of the metrics may take a while.