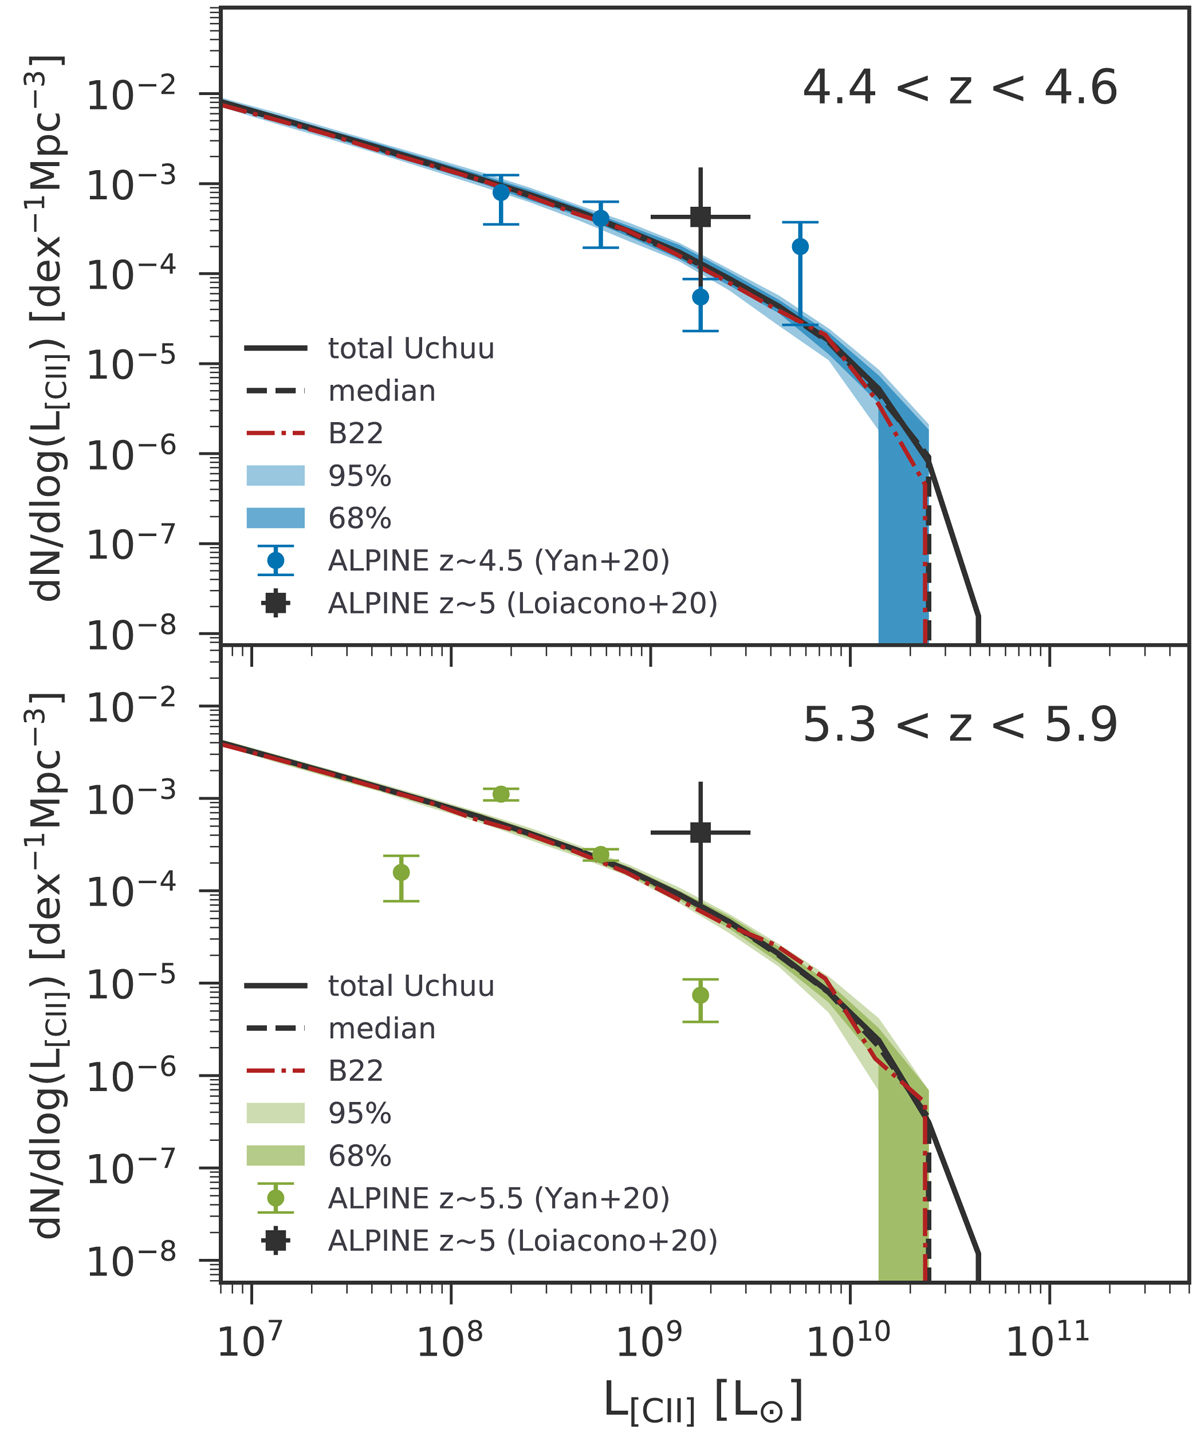
Fig. 6.
Download original image
Comparison of the SIDES [CII] LFs with ALPINE observations. Top panel: ALPINE data at z ∼ 4.5, bottom panel: ALPINE data at z ∼ 5.5. In both panels, the black solid line corresponds to the total Uchuu field LF and the dashed line corresponds to the median LF of 54 2 deg2 SIDES-Uchuu subfields. The shaded areas are the 16th–84th and 5th–95th percentile intervals while the red line is the SIDES-Bolshoi LF (B22). The blue and green points are the data from Yan et al. (2020), while the black square is the data point from Loiacono et al. (2021).
Current usage metrics show cumulative count of Article Views (full-text article views including HTML views, PDF and ePub downloads, according to the available data) and Abstracts Views on Vision4Press platform.
Data correspond to usage on the plateform after 2015. The current usage metrics is available 48-96 hours after online publication and is updated daily on week days.
Initial download of the metrics may take a while.