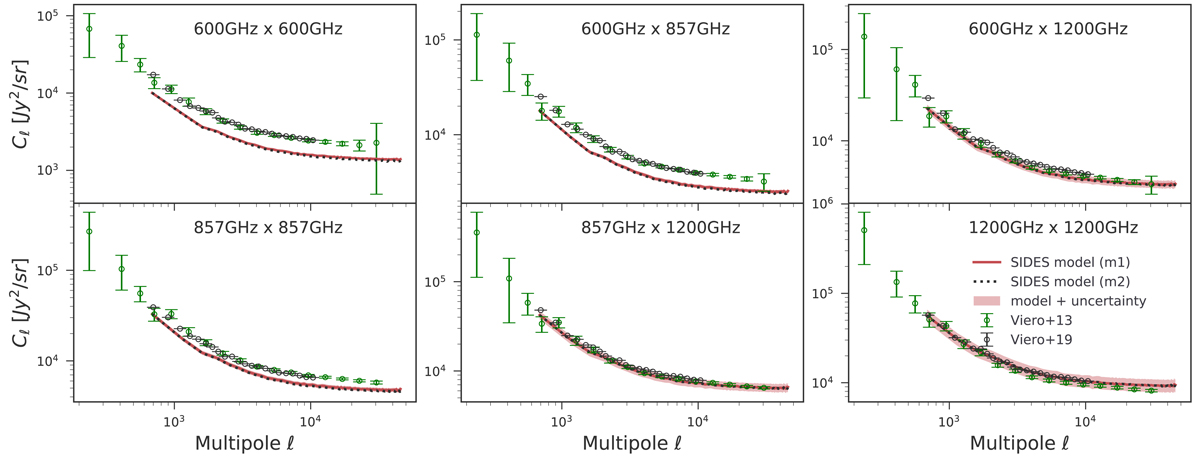
Fig. 4.
Download original image
Comparison of the SIDES power spectrum model with Herschel/SPIRE data. The solid red line corresponds to the SIDES model where we have followed the masking technique of Viero et al. (2013), noted as m1. On top of the SIDES models we illustrate the corresponding systematic uncertainty (i.e., absolute calibration) as described in Sect. 3.2 (red shaded area). The dotted black line is the SIDES model following the masking technique of Viero et al. (2019), noted as m2. The green points are the corresponding observational data presented in Viero et al. (2013) while in black the data from Viero et al. (2019).
Current usage metrics show cumulative count of Article Views (full-text article views including HTML views, PDF and ePub downloads, according to the available data) and Abstracts Views on Vision4Press platform.
Data correspond to usage on the plateform after 2015. The current usage metrics is available 48-96 hours after online publication and is updated daily on week days.
Initial download of the metrics may take a while.