Fig. 3.
Download original image
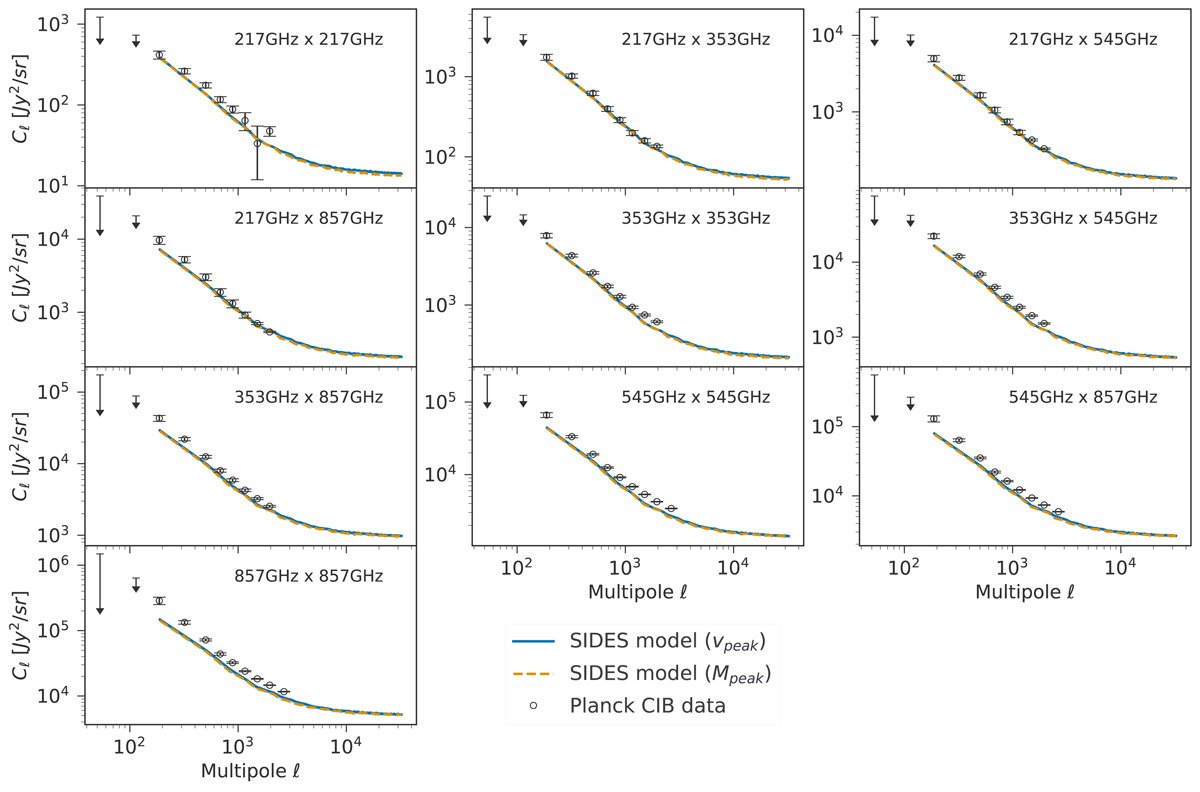
Comparison of SIDES and measured CIB power spectra for Planck. The solid blue lines represent the SIDES power spectra for the Planck bandpass, using vpeak as proxy for the abundance matching. The dashed orange line is the power spectrum obtained using the Mpeak as proxy. The black points are the observational data from Planck (Planck Collaboration XXX 2014).
Current usage metrics show cumulative count of Article Views (full-text article views including HTML views, PDF and ePub downloads, according to the available data) and Abstracts Views on Vision4Press platform.
Data correspond to usage on the plateform after 2015. The current usage metrics is available 48-96 hours after online publication and is updated daily on week days.
Initial download of the metrics may take a while.