Open Access
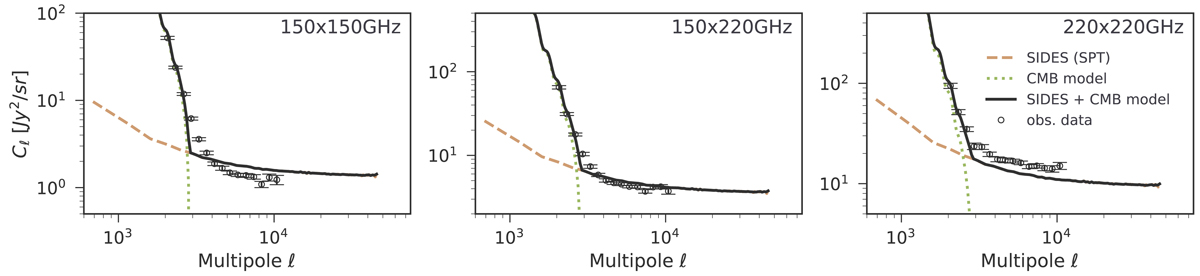
Fig. A.1.
Download original image
Comparison of the SPT auto and cross power spectra of the 150 and 220 GHz bands (black points, Viero et al. 2019) and the SIDES model (brown dashed line). The green dotted line model is the contribution of the CMB in the data. The sum of the SIDES and CMB model is shown with the black solid line.
Current usage metrics show cumulative count of Article Views (full-text article views including HTML views, PDF and ePub downloads, according to the available data) and Abstracts Views on Vision4Press platform.
Data correspond to usage on the plateform after 2015. The current usage metrics is available 48-96 hours after online publication and is updated daily on week days.
Initial download of the metrics may take a while.