Fig. 17.
Download original image
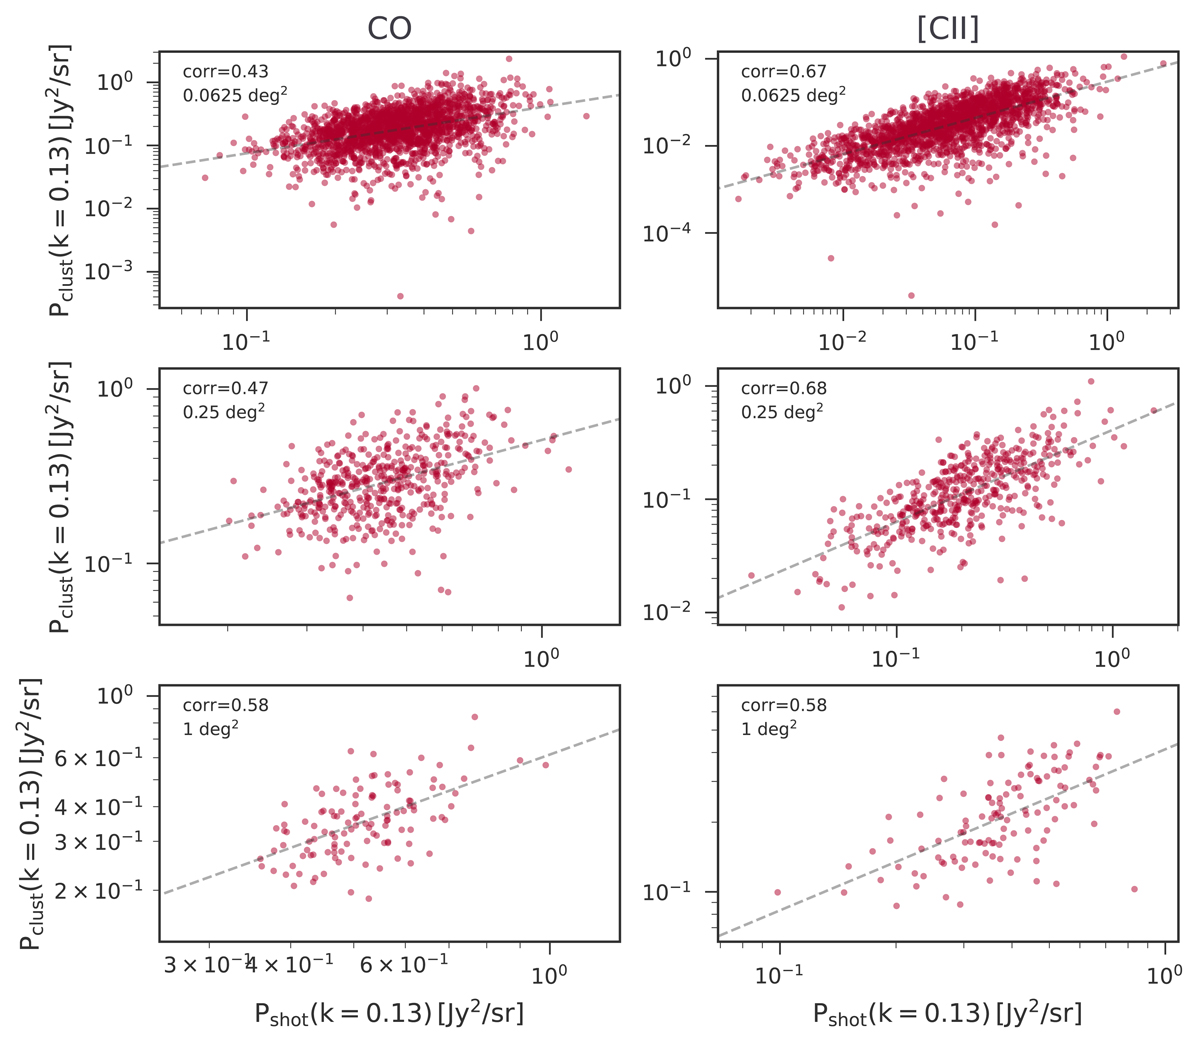
Correlation between the power spectra of the clustering and the shot noise from various subfields for the frequency range 295–305 GHz. The left column is for the CO power spectra for sizes from top to the bottom: 0.0625, 0.25, and 1 deg2. The right column is for the [CII] power spectra for the same sizes as the CO. On the top left of each panel we show the correlation value, while the dashed line shows the corresponding linear line.
Current usage metrics show cumulative count of Article Views (full-text article views including HTML views, PDF and ePub downloads, according to the available data) and Abstracts Views on Vision4Press platform.
Data correspond to usage on the plateform after 2015. The current usage metrics is available 48-96 hours after online publication and is updated daily on week days.
Initial download of the metrics may take a while.