Fig. 16.
Download original image
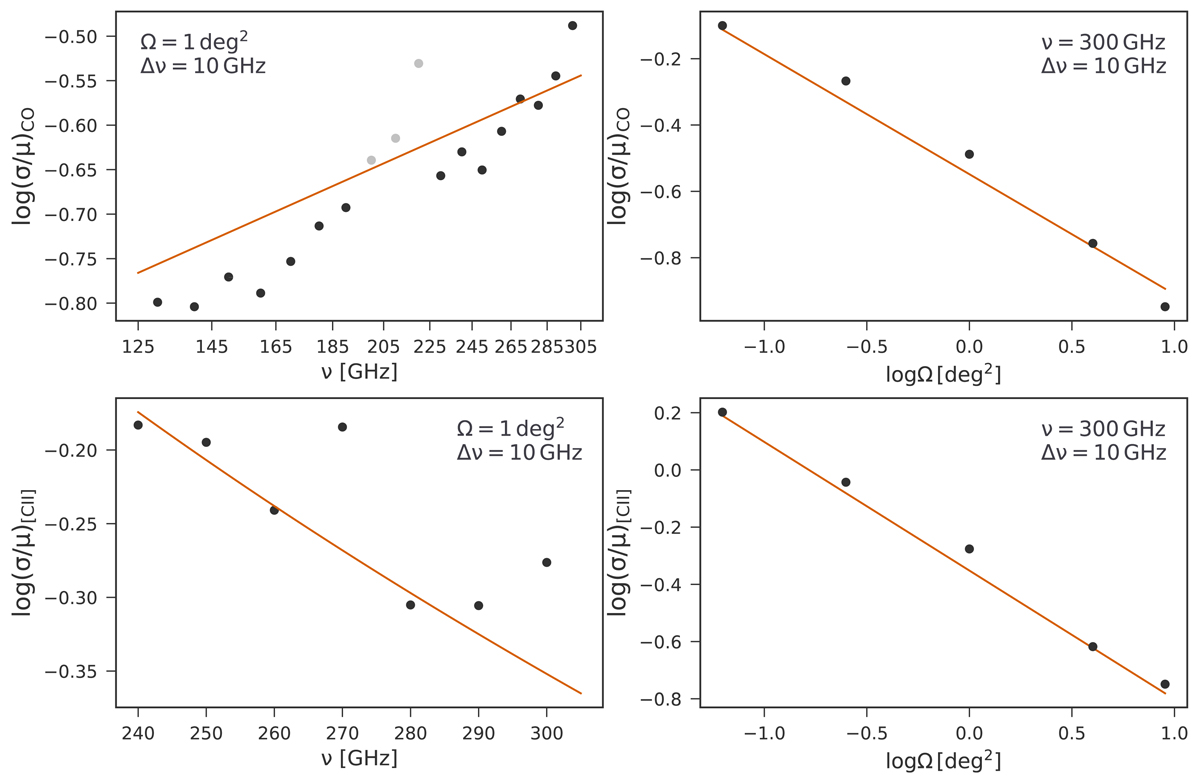
Dependence of the clustering power spectrum variance (0.13 < k < 1 arcmin−1) on the observing frequency (ν) and the survey size (Ω). Top row: the black points are the CO data while the high transparency points are the ones excluded due to the CO(2–1) contamination as explained in Sect. 5.2. The solid orange line is the best-fit model. Bottom row: the black points are the [CII] data and the orange solid line is the best-fit model.
Current usage metrics show cumulative count of Article Views (full-text article views including HTML views, PDF and ePub downloads, according to the available data) and Abstracts Views on Vision4Press platform.
Data correspond to usage on the plateform after 2015. The current usage metrics is available 48-96 hours after online publication and is updated daily on week days.
Initial download of the metrics may take a while.