Open Access
Fig. 15.
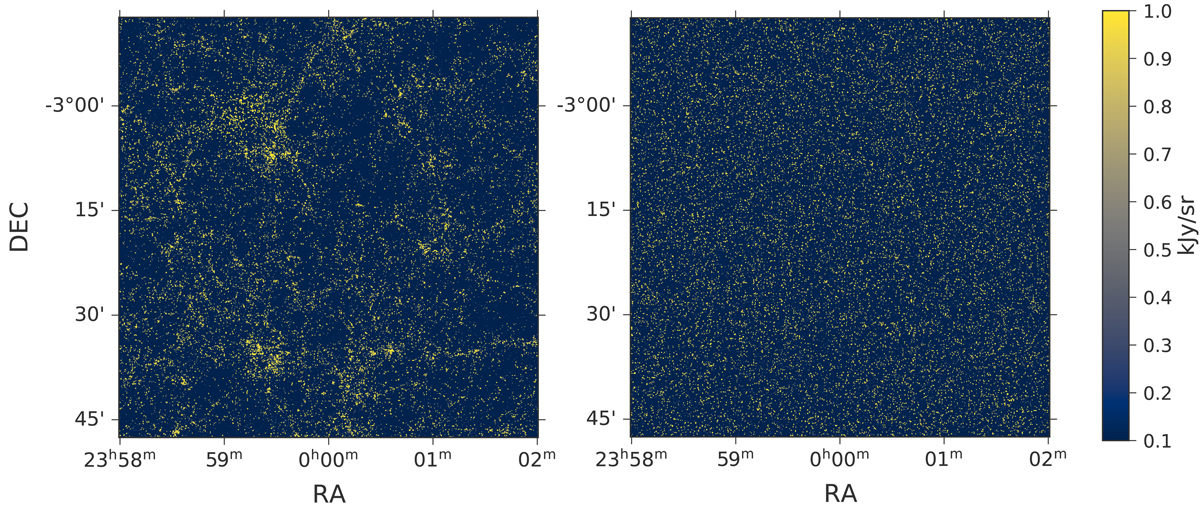
Download original image
Visualization of the 275 GHz slice of an original CO cube on the left and the shuffled cube on the right. The shuffled cube contains the same sources (same redshift and luminosity) as the one on the left but is randomly distributed.
Current usage metrics show cumulative count of Article Views (full-text article views including HTML views, PDF and ePub downloads, according to the available data) and Abstracts Views on Vision4Press platform.
Data correspond to usage on the plateform after 2015. The current usage metrics is available 48-96 hours after online publication and is updated daily on week days.
Initial download of the metrics may take a while.