Fig. 14.
Download original image
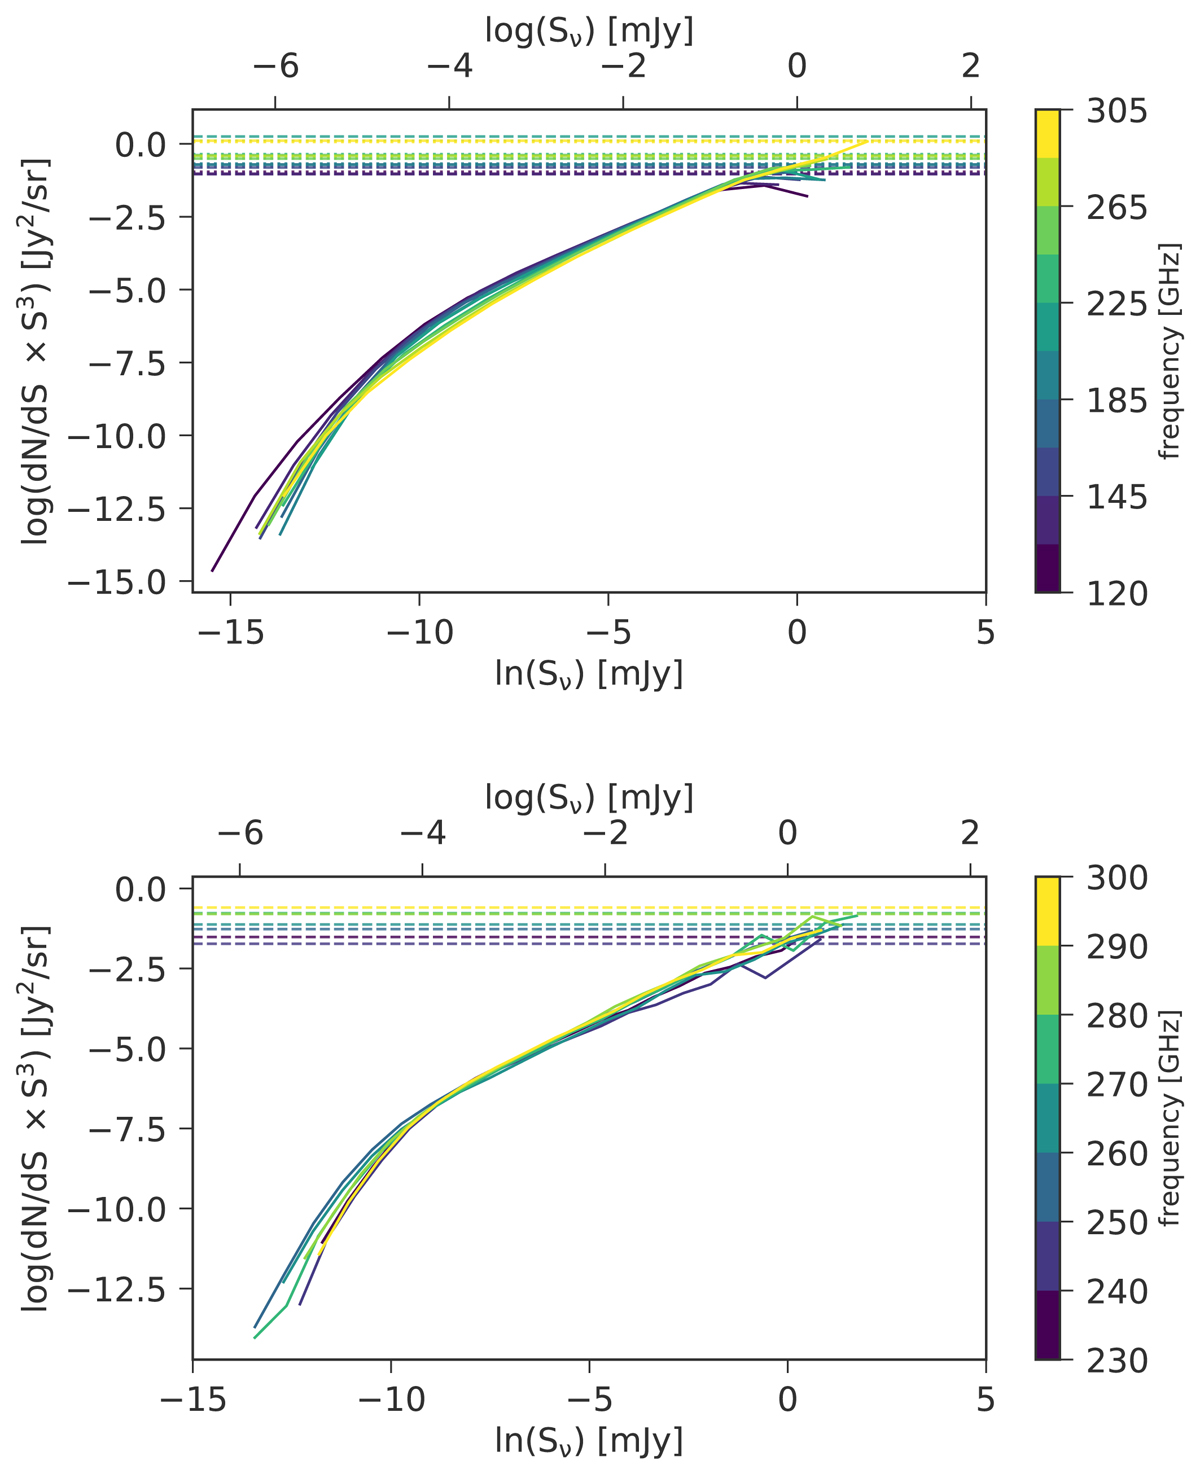
Source flux contribution to the CO (top) and [CII] (bottom) shot noise power spectrum (see Eq. (7)). The different color lines correspond to different frequency slices with the CONCERTO frequency resolution (1.5 GHz) within the whole CONCERTO observing frequency range. The dashed lines are the expected shot noise level as computed by Eq. (7).
Current usage metrics show cumulative count of Article Views (full-text article views including HTML views, PDF and ePub downloads, according to the available data) and Abstracts Views on Vision4Press platform.
Data correspond to usage on the plateform after 2015. The current usage metrics is available 48-96 hours after online publication and is updated daily on week days.
Initial download of the metrics may take a while.