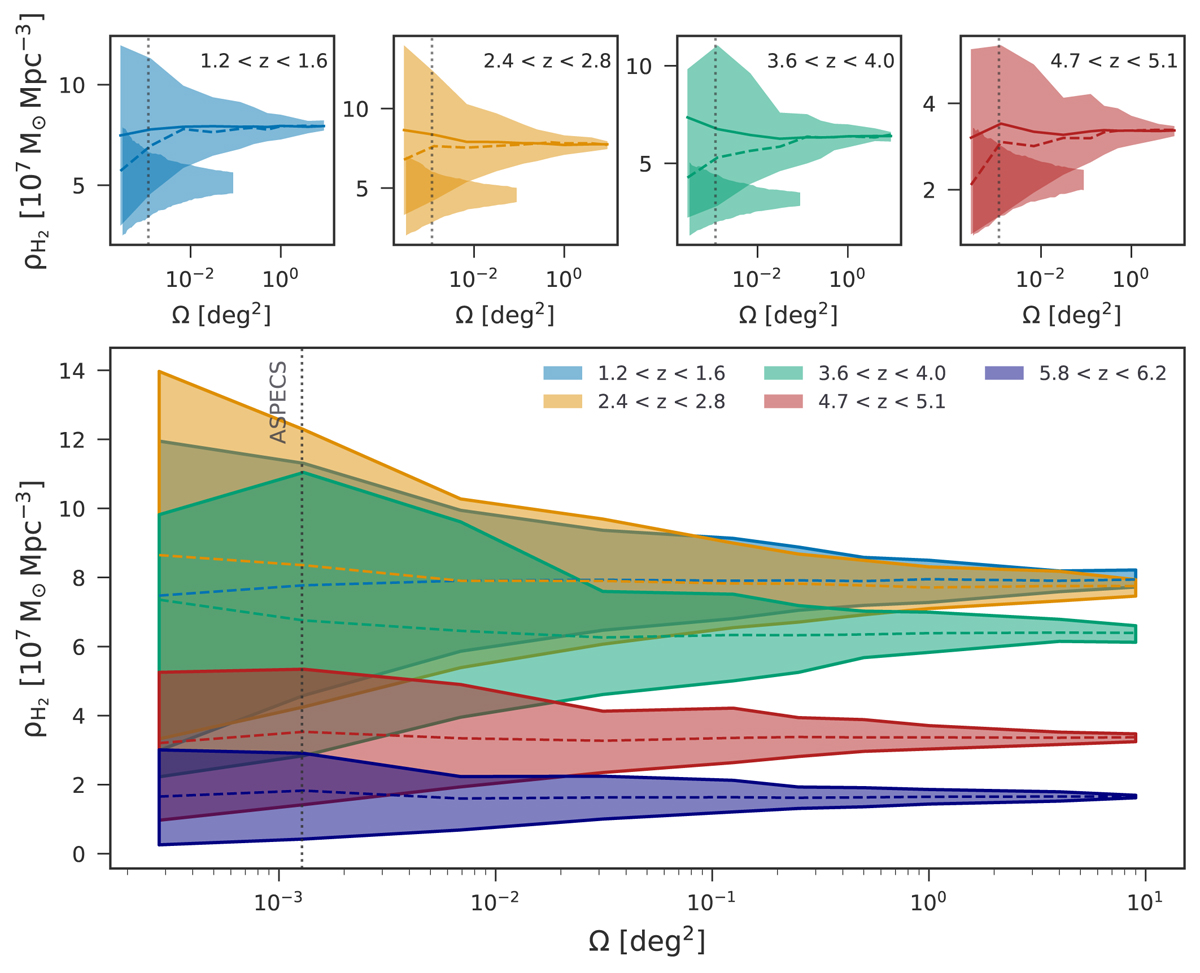
Fig. 10.
Download original image
Top: cosmic variance in the ρH2 values as a function of the survey size for different redshift slices. The solid and dashed lines are the mean and median values, respectively. We have also included the corresponding results from Keenan et al. (2020) (the shaded and hatched areas). Bottom: evolution with redshift of the variance in the molecular gas mass density as a function of survey sizes, where it is easier to spot what is the proper survey size that will allow to probe the evolution of the molecular gas density.
Current usage metrics show cumulative count of Article Views (full-text article views including HTML views, PDF and ePub downloads, according to the available data) and Abstracts Views on Vision4Press platform.
Data correspond to usage on the plateform after 2015. The current usage metrics is available 48-96 hours after online publication and is updated daily on week days.
Initial download of the metrics may take a while.