Fig. 1.
Download original image
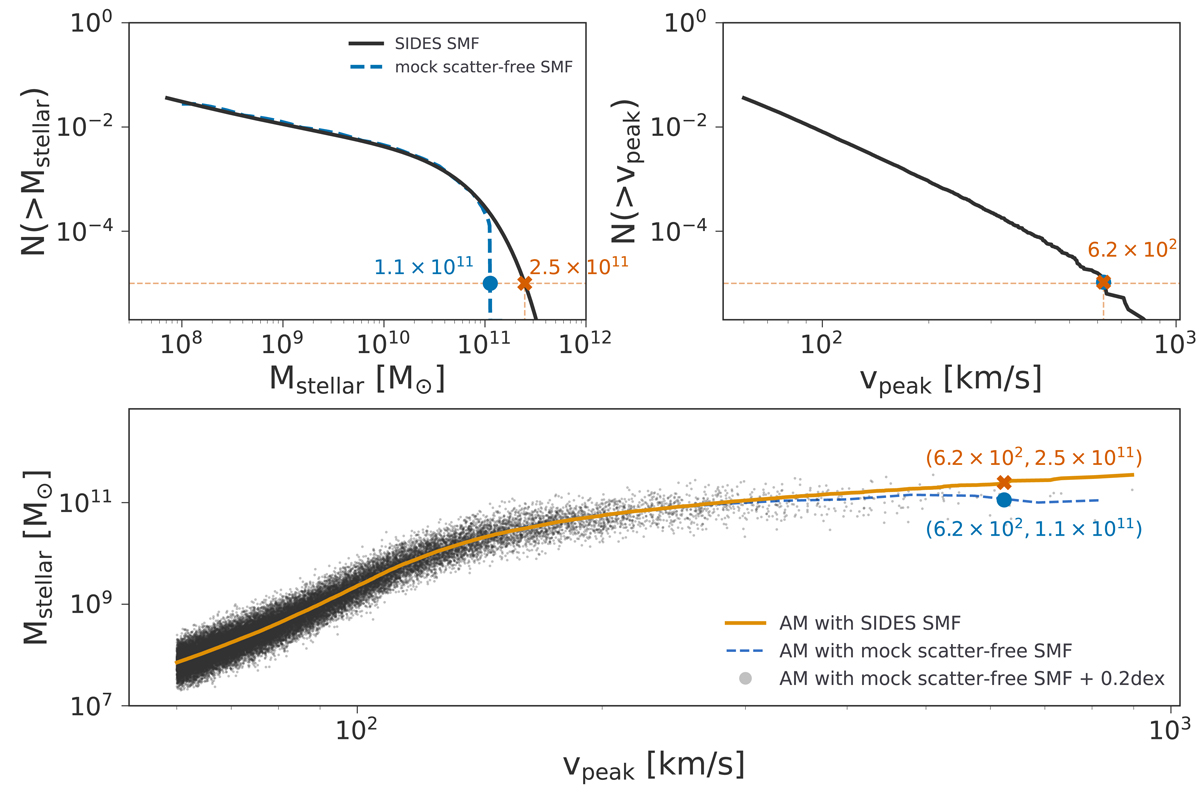
Explanation of our abundance matching (AM) method between dark matter halos and galaxies. In the top left panel we show the cumulative SIDES stellar mass function (SMF, black solid line) and the mock scatter-free SMF (dashed blue line, Sect. 2.3) which is obtained after the deconvolution of the SIDES SMF with the 0.2 dex scatter. In the top right panel we show the cumulative halo velocity function. In the bottom panel we show the resulting relation between the stellar mass and the halo peak velocity when performing direct abundance matching using the SIDES SMF (orange line) and the mock scatter-free SMF (dashed blue line). The black points are the stellar masses assigned to the halos of our simulated catalog using the scatter-free relation (blue dashed line) and adding a 0.2 dex log-normal scatter. All plots are made for the 0.05 < z < 0.1 redshift range.
Current usage metrics show cumulative count of Article Views (full-text article views including HTML views, PDF and ePub downloads, according to the available data) and Abstracts Views on Vision4Press platform.
Data correspond to usage on the plateform after 2015. The current usage metrics is available 48-96 hours after online publication and is updated daily on week days.
Initial download of the metrics may take a while.