Fig. 13
Download original image
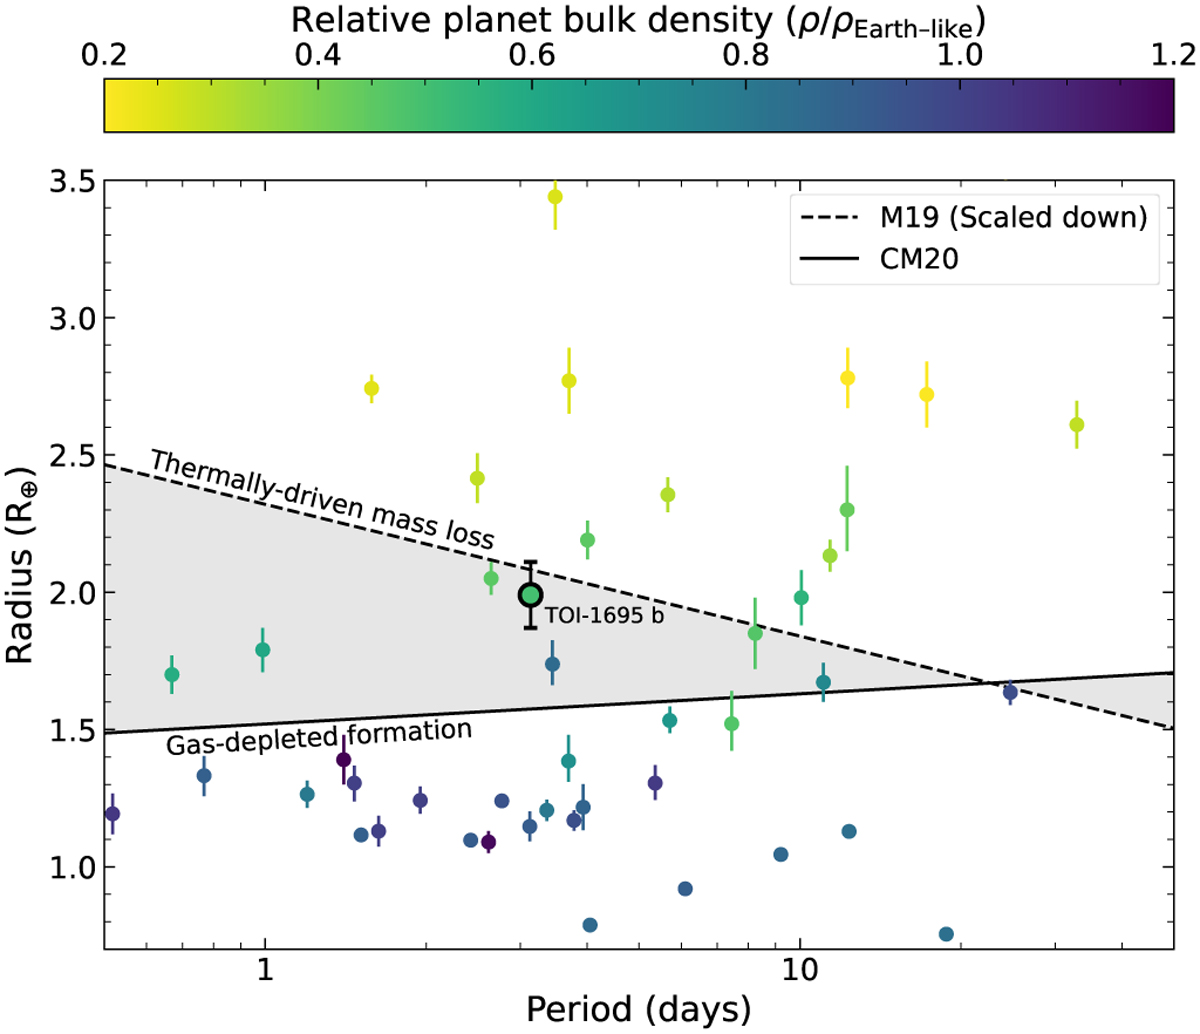
Rp-Porb diagram for exoplanets around cool stars (Teff < 4000 K) taken from the NASA exoplanet archive. The solid and dashed lines represent respectively the Cloutier & Menou (2020) and Martinez et al. (2019) empirical radius valley (see text). The shaded region shows exoplanets that from their gas content could be able to test gas-depleted formation and thermally driven mass loss scenarios. TOI-1695 b is highlighted as a thick-lined black circle.
Current usage metrics show cumulative count of Article Views (full-text article views including HTML views, PDF and ePub downloads, according to the available data) and Abstracts Views on Vision4Press platform.
Data correspond to usage on the plateform after 2015. The current usage metrics is available 48-96 hours after online publication and is updated daily on week days.
Initial download of the metrics may take a while.