Fig. 12
Download original image
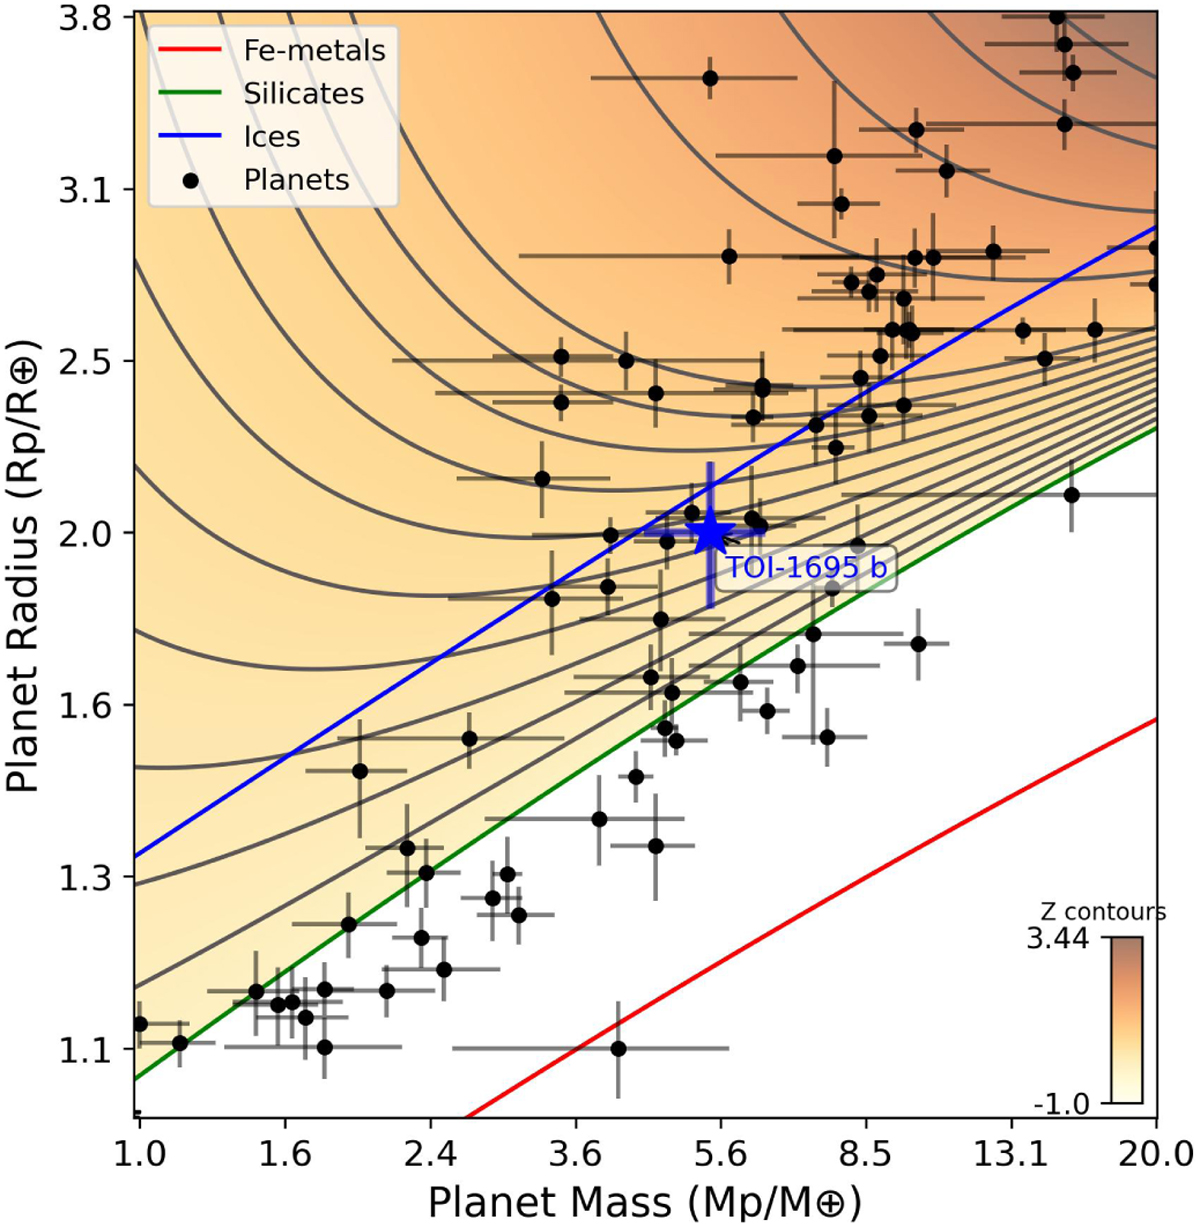
Mass-radius plot obtained based on the pyExoRaMa code (Zeng et al. 2021; Francesco et al. 2022). The red, green, and blue solid lines represent the mass-radius relation for respectively pure Fe, silicate, and H2O core. The yellow-brown z-contours (see Zeng et al. 2021 for details) with black solid lines represent the radius inflation due to gas in an envelope surrounding the planet core corresponding to pure silicate. The comparison planets (black circles) are taken from the TepCat database (Southworth 2011), selecting only exoplanets around M and Κ host stars. TOI-1695 b is shown as a blue star.
Current usage metrics show cumulative count of Article Views (full-text article views including HTML views, PDF and ePub downloads, according to the available data) and Abstracts Views on Vision4Press platform.
Data correspond to usage on the plateform after 2015. The current usage metrics is available 48-96 hours after online publication and is updated daily on week days.
Initial download of the metrics may take a while.