Open Access
Fig. 1
Download original image
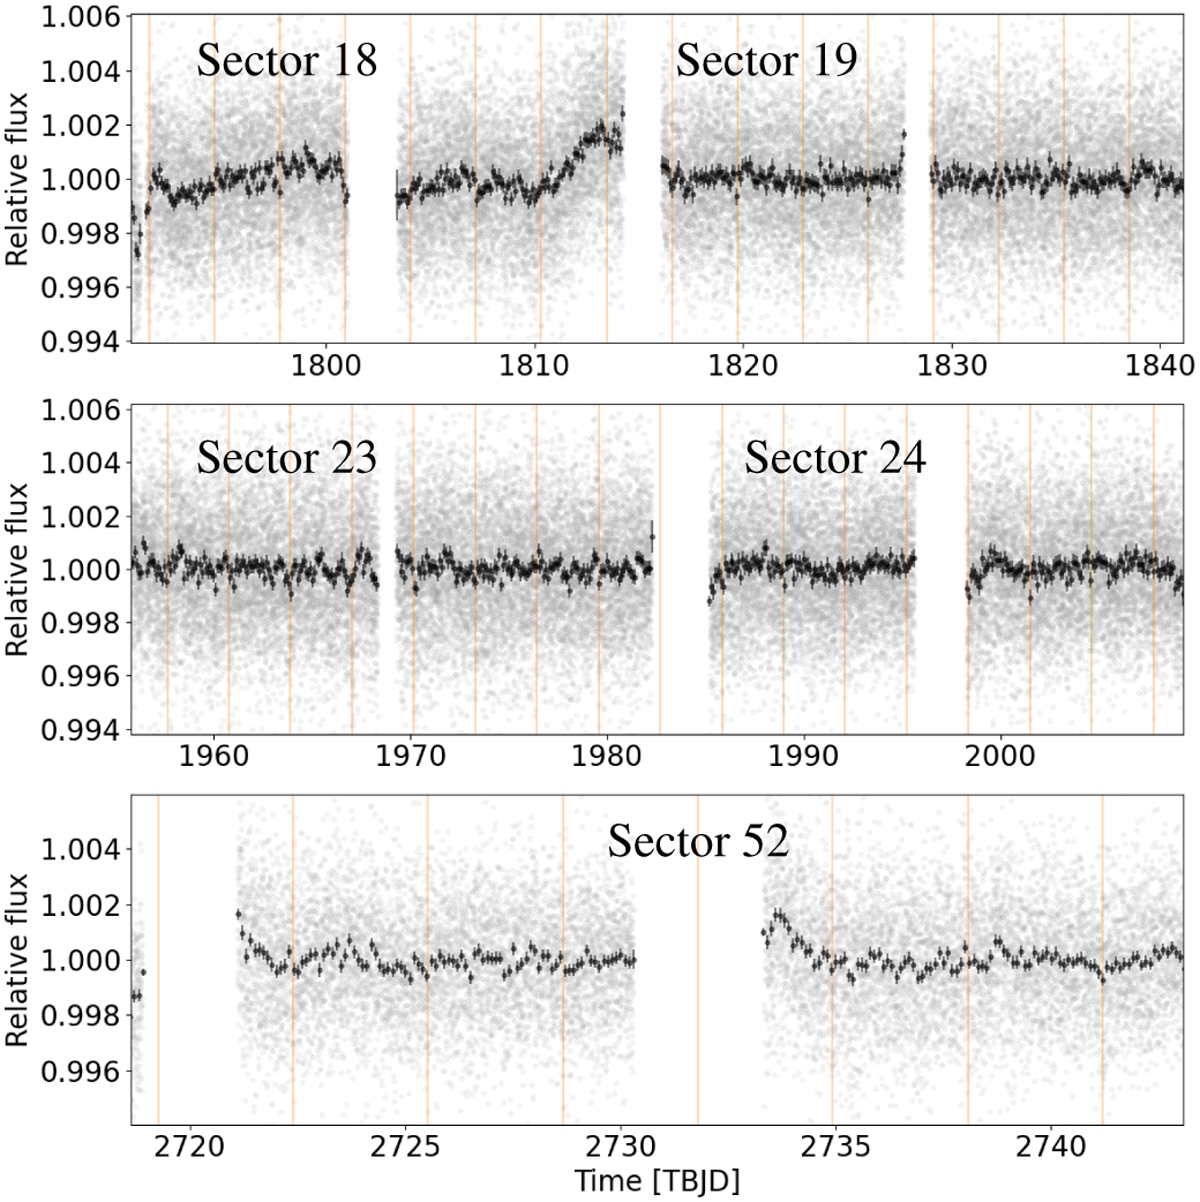
Full TESS light curve separated in sectors (gray dots) and binned with a 0.1-day timestep (black). The identified transit locations are shown as orange vertical lines.
Current usage metrics show cumulative count of Article Views (full-text article views including HTML views, PDF and ePub downloads, according to the available data) and Abstracts Views on Vision4Press platform.
Data correspond to usage on the plateform after 2015. The current usage metrics is available 48-96 hours after online publication and is updated daily on week days.
Initial download of the metrics may take a while.