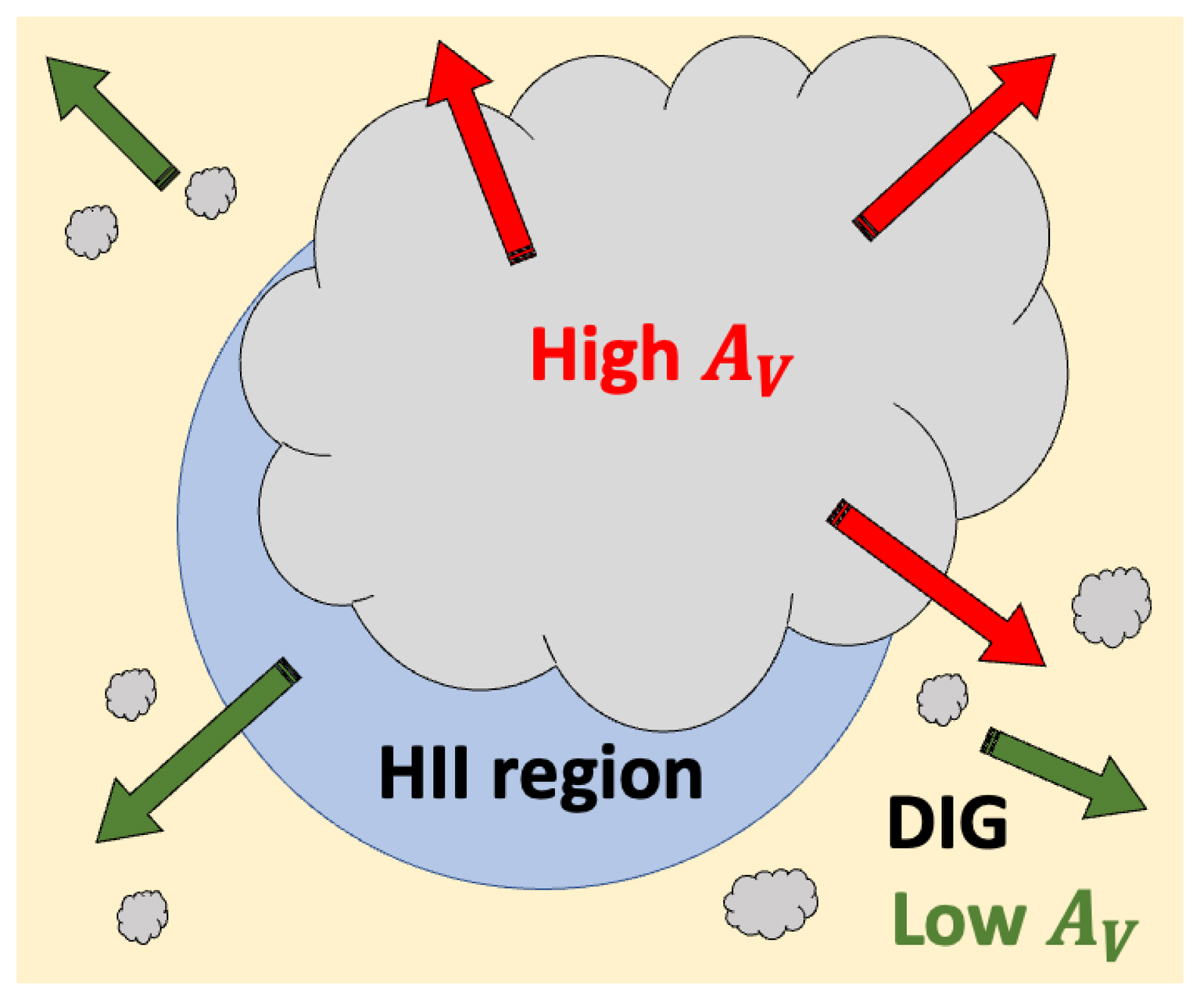
Fig. 9.
Download original image
Cartoon illustration of a two-component attenuation model. The model consists of a more attenuated component with high AV and a less attenuated component with low AV. The emission lines from both components are mixed in observations. While the high AV component is (part of) a dusty H II region, the low AV component could be a part of the H II region that is less dusty, the DIG around the H II region, or a combination of both.
Current usage metrics show cumulative count of Article Views (full-text article views including HTML views, PDF and ePub downloads, according to the available data) and Abstracts Views on Vision4Press platform.
Data correspond to usage on the plateform after 2015. The current usage metrics is available 48-96 hours after online publication and is updated daily on week days.
Initial download of the metrics may take a while.