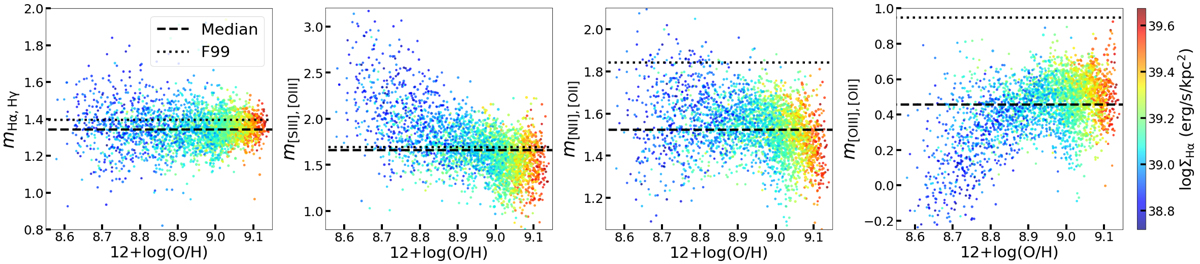
Fig. 8.
Download original image
Derived slopes for different line ratios as a function of the gas-phase metallicity. The y axes correspond to slopes of the log(fline1/fline2) versus log(Hα/Hβ/2.86) relations. The x axes correspond to metallicities derived by using Bayesian inference with a fiducial photoionization model. Each data point corresponds to a 3D bin with number of spaxels greater than 180. The 3D bins are color-coded according to the median Hα surface brightness (which is corrected by the Balmer decrement assuming an F99 extinction curve) of their spaxels. Dashed black lines and dotted black lines correspond to the median slopes and the values predicted by an F99 extinction curve, respectively.
Current usage metrics show cumulative count of Article Views (full-text article views including HTML views, PDF and ePub downloads, according to the available data) and Abstracts Views on Vision4Press platform.
Data correspond to usage on the plateform after 2015. The current usage metrics is available 48-96 hours after online publication and is updated daily on week days.
Initial download of the metrics may take a while.