Fig. 7.
Download original image
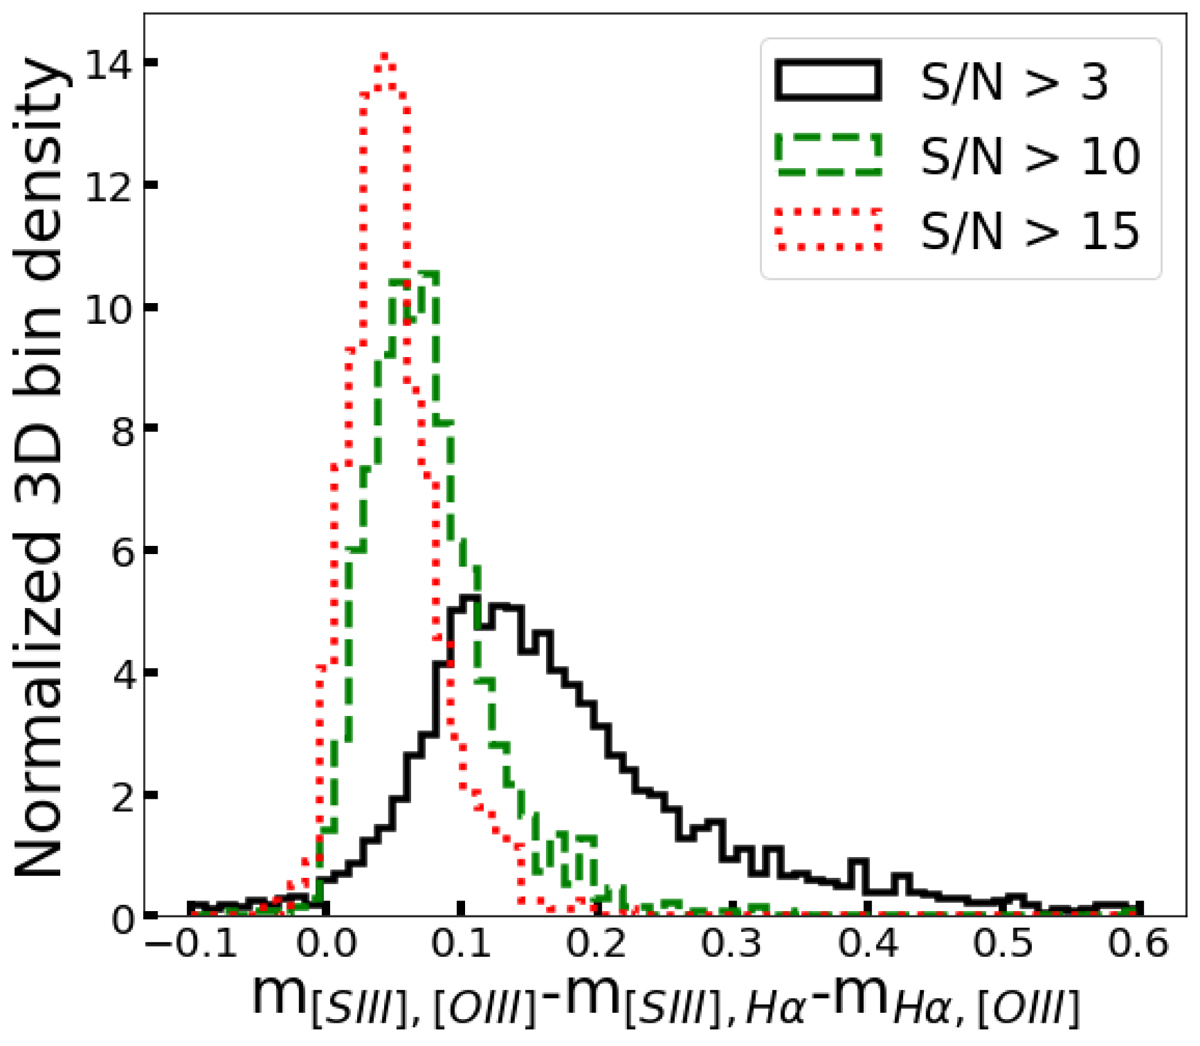
Distributions of the slope differences under different S/N cuts. The black solid histogram shows data with S/N of [S III], [O III], and Hβ greater than 3; the dashed green histogram shows data with S/N of the aforementioned lines greater than 10; the dotted red histogram shows data with S/N of the aforementioned lines greater than 15. The slope difference peaks toward smaller values with the increasing S/N limit. However, the difference is actually due to the dependence of the slope on the surface brightness of the lines.
Current usage metrics show cumulative count of Article Views (full-text article views including HTML views, PDF and ePub downloads, according to the available data) and Abstracts Views on Vision4Press platform.
Data correspond to usage on the plateform after 2015. The current usage metrics is available 48-96 hours after online publication and is updated daily on week days.
Initial download of the metrics may take a while.