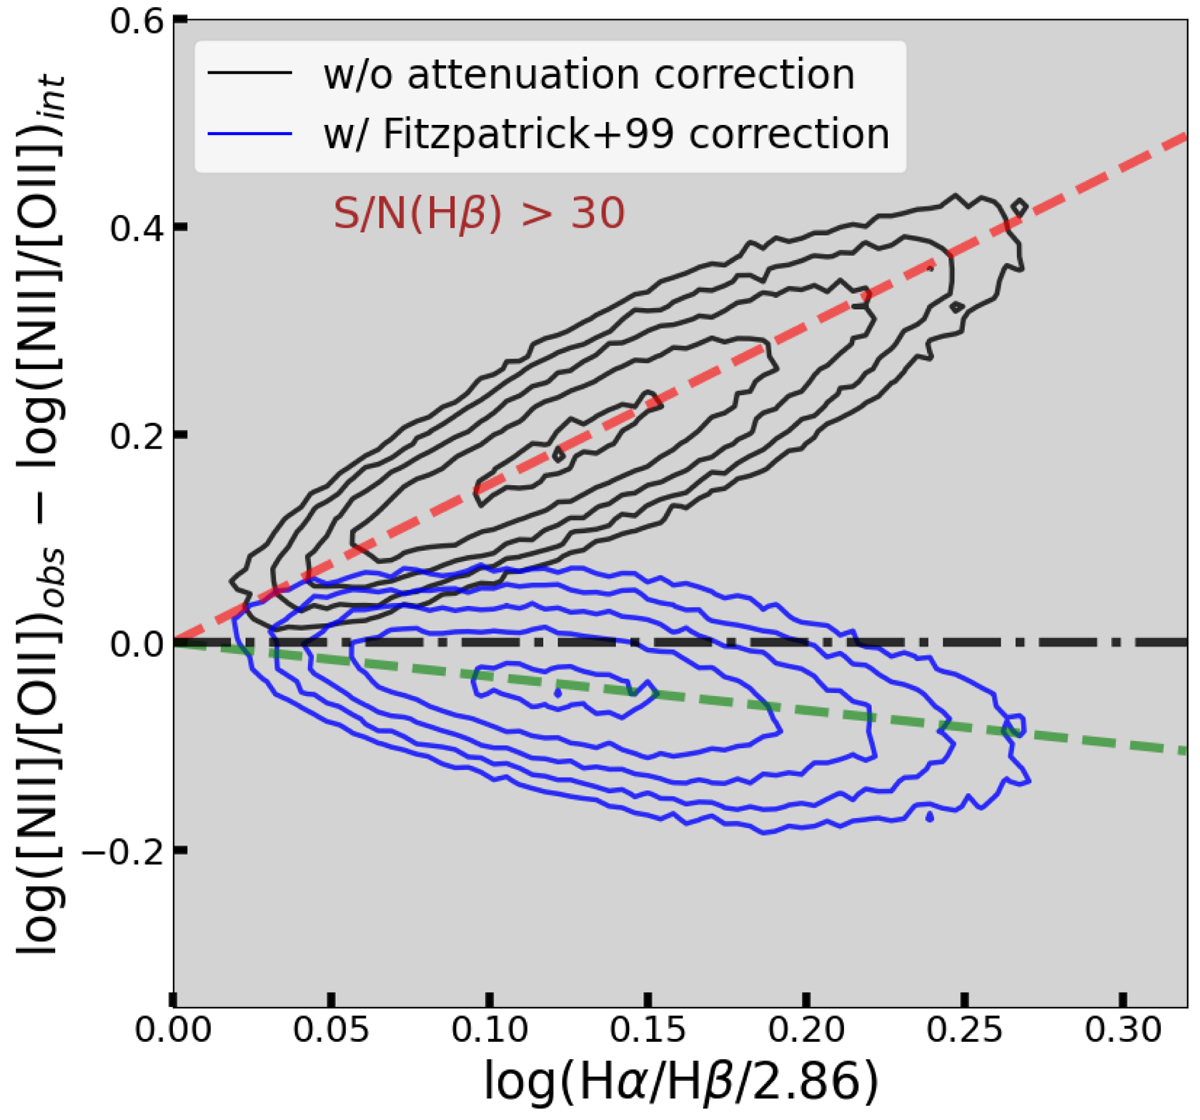
Fig. 6.
Download original image
Reddening relation between log([N II]/[O II]) and log(Hα/Hβ/2.86). Only data with S/N > 30 in Hβ are included. We obtained the intrinsic log([N II]/[O II]) value at log(Hα/Hβ/2.86) = 0 and subtracted it from the observed log([N II]/[O II]) for each 3D bin. The black contours show the distribution of the data without any attenuation correction. Whereas the blue contours show the density distribution of the data with their log([N II]/[O II]) corrected by the F99 extinction curve. The contour levels trace the number density of the data points and are equally spaced on a log scale. The outermost contour and the innermost contour enclose 90% and 10% of the data, respectively. The dashed red line and the dashed green line trace the median trends in the 3D bins for the two data sets. The dash-dotted line is a horizontal line for reference.
Current usage metrics show cumulative count of Article Views (full-text article views including HTML views, PDF and ePub downloads, according to the available data) and Abstracts Views on Vision4Press platform.
Data correspond to usage on the plateform after 2015. The current usage metrics is available 48-96 hours after online publication and is updated daily on week days.
Initial download of the metrics may take a while.