Fig. 2.
Download original image
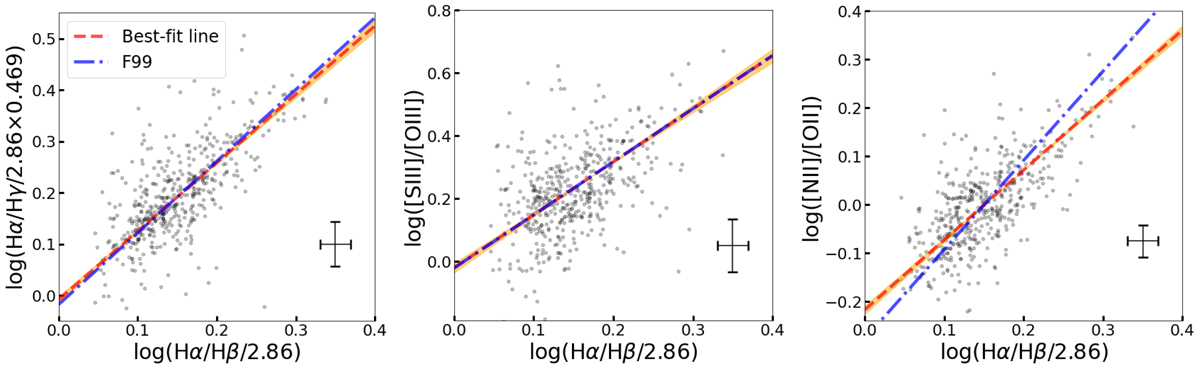
Fitting examples in one of the 3D bins. The dashed red lines are the best-fit lines given by the maximum-likelihood method. The orange shaded regions indicate the 1σ uncertainties of the linear models. The dash-dotted blue lines are obtained by fixing the slopes using the values from an F99 extinction curve with RV = 3.1 during the fit. The error bars indicate the measurement uncertainties in different logarithmic line ratios. Left: reddening relation between Hα/Hβ and Hα/Hγ. Middle: reddening relation between Hα/Hβ and [S III]/[O III]. Right: reddening relation between Hα/Hβ and [N II]/[O II].
Current usage metrics show cumulative count of Article Views (full-text article views including HTML views, PDF and ePub downloads, according to the available data) and Abstracts Views on Vision4Press platform.
Data correspond to usage on the plateform after 2015. The current usage metrics is available 48-96 hours after online publication and is updated daily on week days.
Initial download of the metrics may take a while.