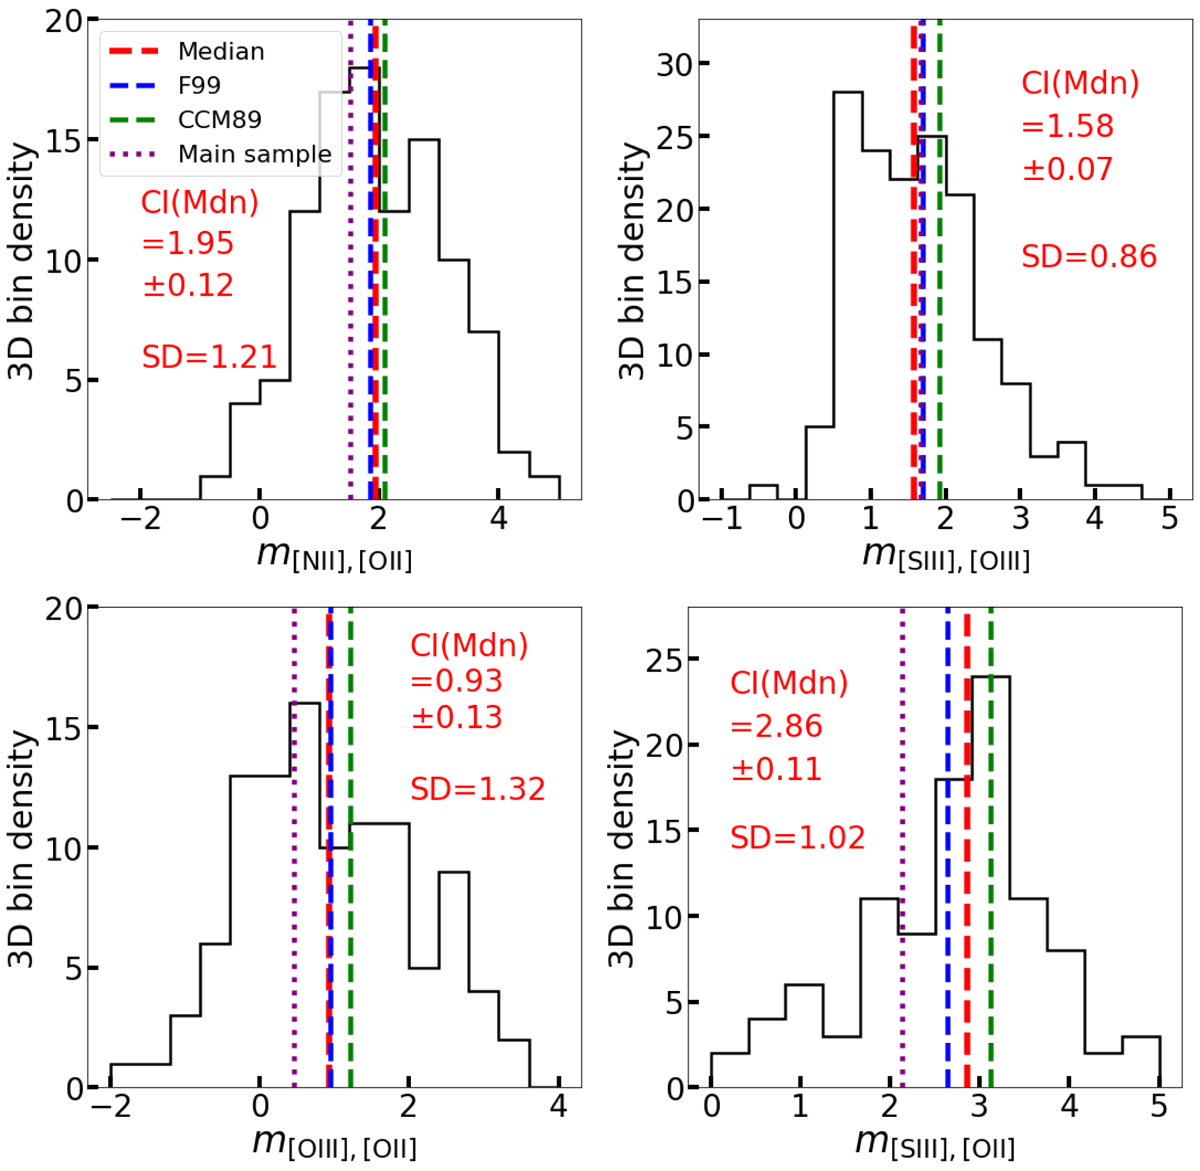
Fig. C.1.
Download original image
Slope distributions for different reddening relations in IC 342. For each distribution, we show the 68% confidence interval of the median [CI(Mdn)] and the standard deviation (SD). Dashed lines mark the medians of the distributions (red), values predicted by the F99 extinction curve (blue), and values predicted by the CCM89 extinction curve (green). The median values found in the MaNGA main sample are indicated by the dotted purple lines.
Current usage metrics show cumulative count of Article Views (full-text article views including HTML views, PDF and ePub downloads, according to the available data) and Abstracts Views on Vision4Press platform.
Data correspond to usage on the plateform after 2015. The current usage metrics is available 48-96 hours after online publication and is updated daily on week days.
Initial download of the metrics may take a while.