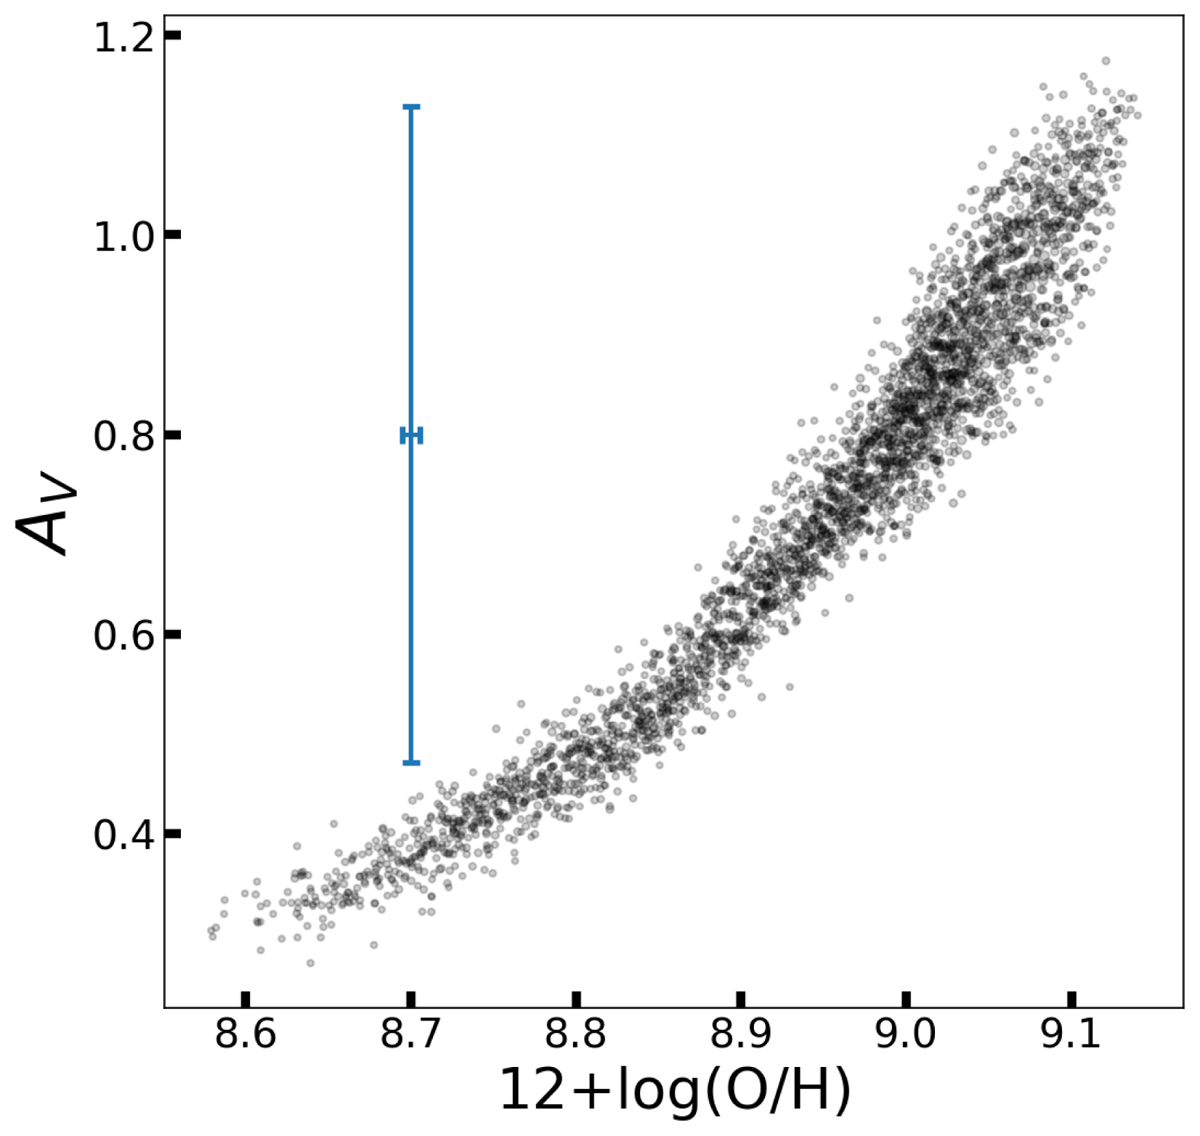
Fig. 13.
Download original image
Correlation between the metallicity and the V-band attenuation AV for the 3D bins that contain more than 180 spaxels. The V-band attenuation is derived from the Balmer decrement. For each 3D bin, the median values of 12+log(O/H) and AV are plotted. The vertical and horizontal errorbars show the typical (median) standard deviations of AV and 12+log(O/H), respectively, in each 3D bin.
Current usage metrics show cumulative count of Article Views (full-text article views including HTML views, PDF and ePub downloads, according to the available data) and Abstracts Views on Vision4Press platform.
Data correspond to usage on the plateform after 2015. The current usage metrics is available 48-96 hours after online publication and is updated daily on week days.
Initial download of the metrics may take a while.