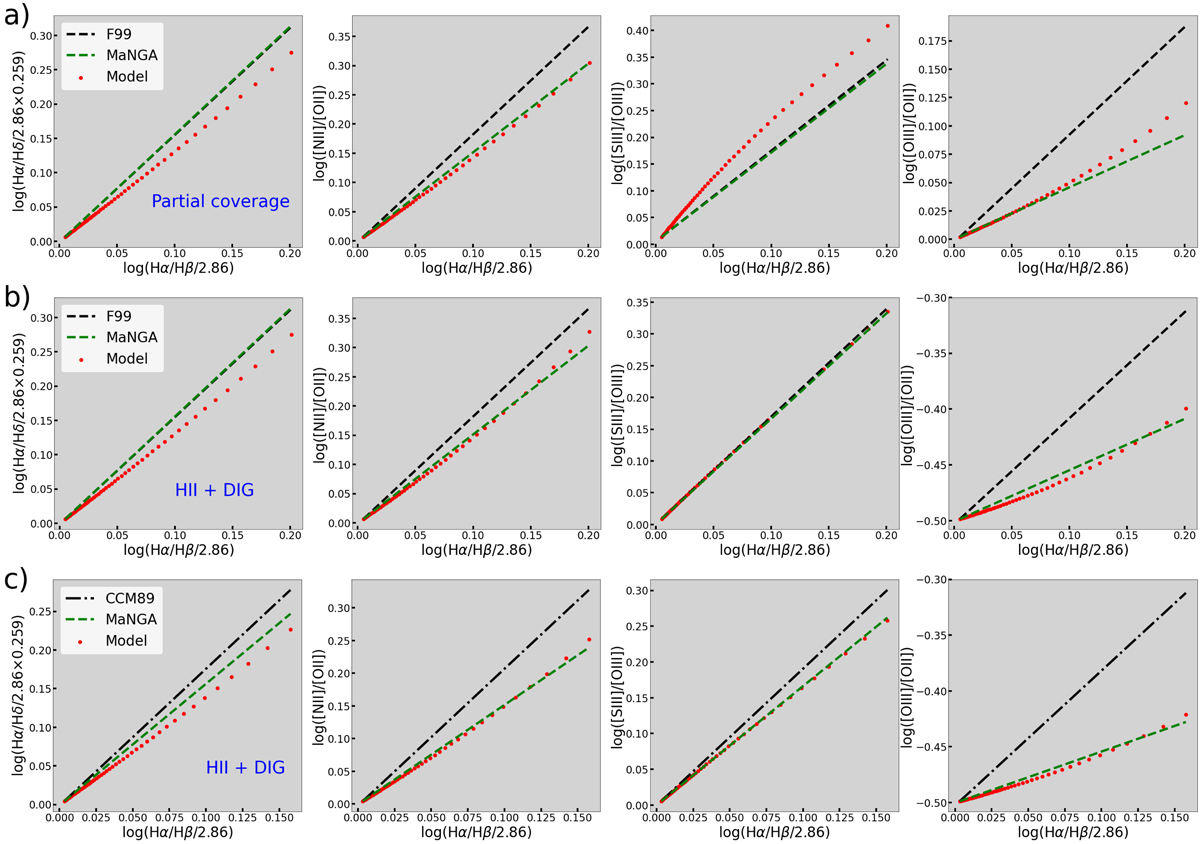
Fig. 10.
Download original image
Effective attenuation laws generated by different models. Row a) shows several logarithmic line ratio versus logarithmic Balmer derement relations predicted by a partially covered cloud model. For comparison, we also plotted the relation predicted by the F99 extinction curve and the median relation we found in MaNGA. Row b) shows the relations predicted by a two-component model with different intrinsic line ratios. We made the H II component to have overall lower intrinsic line ratios (relative to Hα) compared to the DIG component. Row c) shows a similar model as Row b), but the underlying true attenuation curve is replaced with the CCM89 extinction curve. All y axes have arbitrary normalization.
Current usage metrics show cumulative count of Article Views (full-text article views including HTML views, PDF and ePub downloads, according to the available data) and Abstracts Views on Vision4Press platform.
Data correspond to usage on the plateform after 2015. The current usage metrics is available 48-96 hours after online publication and is updated daily on week days.
Initial download of the metrics may take a while.