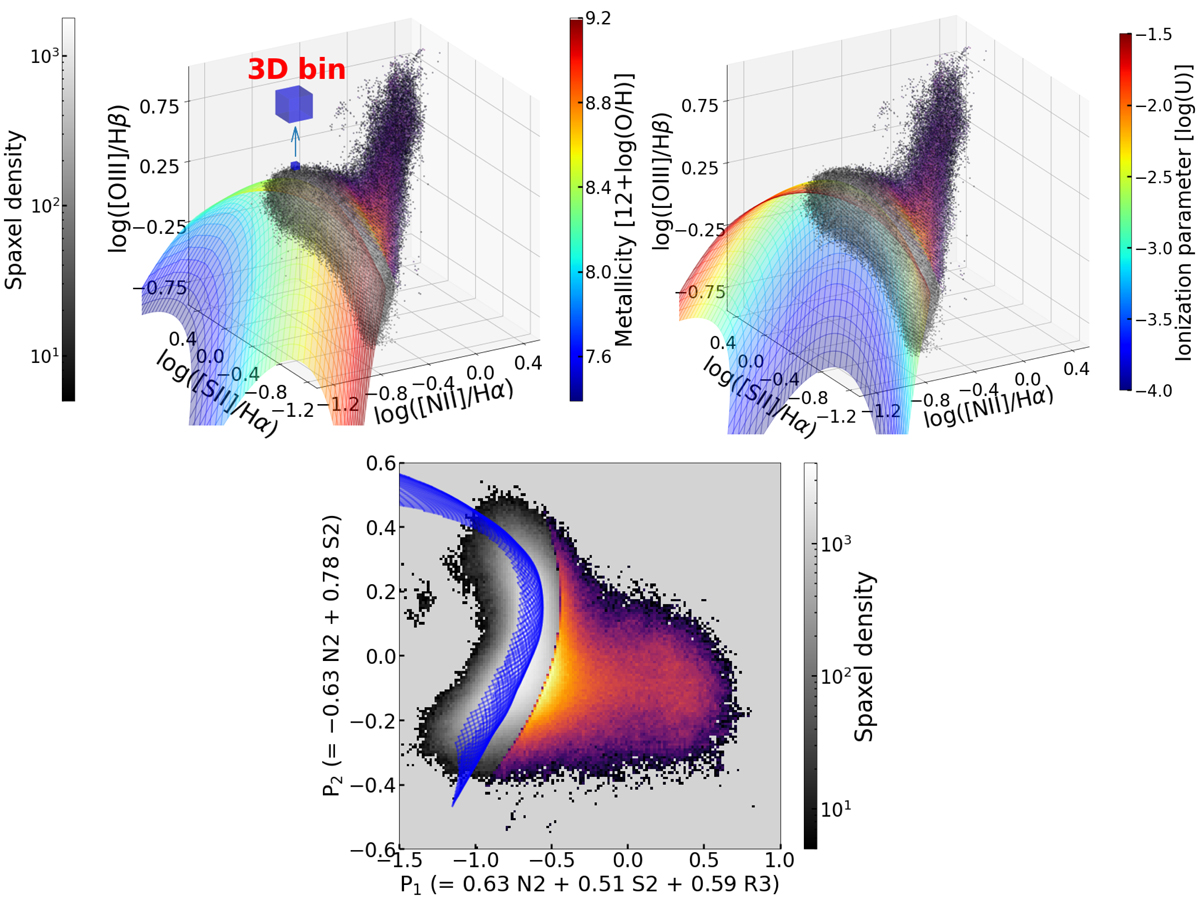
Fig. 1.
Download original image
Distribution of the MaNGA sample viewed in a 3D line-ratio space and in one of its 2D projections. Upper left: 3D density map of the MaNGA sample, where SF spaxels are colored from black to white and other ionized regions are colored from purple to yellow. A photoionization model computed by Ji & Yan (2020) using CLOUDY is also shown, whose color coding indicates the metallicity of the simulated H II region. The blue cube is an exaggerated illustration of the 3D bins we used in this work. Upper right: the same photoionization model is shown, but color coded according to the ionization parameter of the simulated H II region. Bottom: a 2D projection of the 3D space that corresponds to an “edge-on” view of the data (color map) and model (blue). The two axes, P1 and P2, are linear combinations of the original three axes, which are denoted as N2, S2, and R3. For clarity, we only show the part of the model that covers the middle 98% of the data along the line of sight. It is clear from this view that the model surface cuts through the center of the SF spaxel distribution.
Current usage metrics show cumulative count of Article Views (full-text article views including HTML views, PDF and ePub downloads, according to the available data) and Abstracts Views on Vision4Press platform.
Data correspond to usage on the plateform after 2015. The current usage metrics is available 48-96 hours after online publication and is updated daily on week days.
Initial download of the metrics may take a while.