Fig. 3.
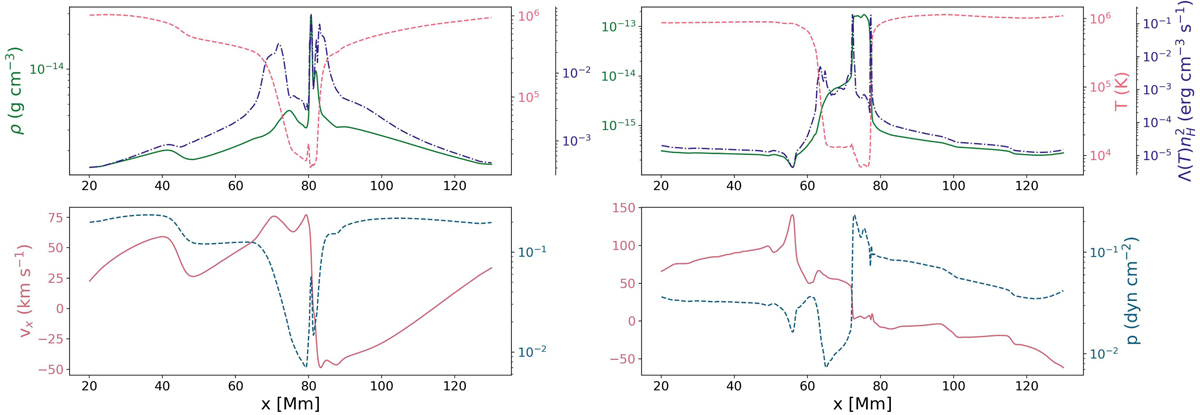
Download original image
x variations of quantities at t = 133 min (left panels, when the first condensation forms) and t = 204 min (right panels). The cut along x at t = 133 min is at y = −1.2 Mm and the cut along x at t = 204 min is at y = −0.8 Mm. In the top panels, the full green line is density, the dashed red line is temperature, and the dashed-dotted indigo line is the radiative losses. In the bottom panels, the solid red line is the x component of the velocity and the dashed blue line is thermal pressure.
Current usage metrics show cumulative count of Article Views (full-text article views including HTML views, PDF and ePub downloads, according to the available data) and Abstracts Views on Vision4Press platform.
Data correspond to usage on the plateform after 2015. The current usage metrics is available 48-96 hours after online publication and is updated daily on week days.
Initial download of the metrics may take a while.