Fig. 1.
Download original image
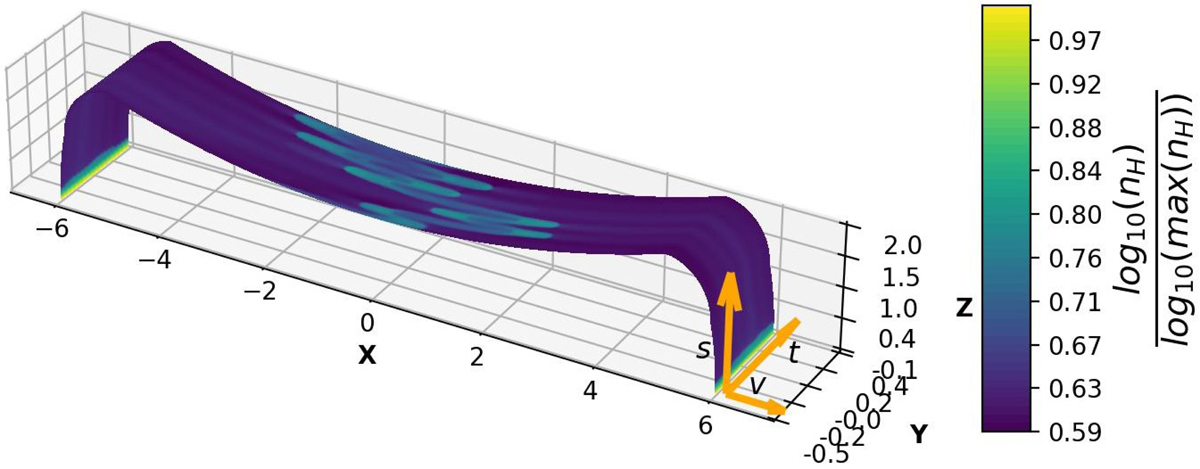
3D shape of our domain (x, y and z axis with units of ×10 Mm) with over-plotted, normalised number density values at t = 261 min of the reference case. The coordinate system marked in orange describes the s and t axis, along and transverse to the magnetic field lines, respectively. The v axis is perpendicular to the magnetic field lines (and does not exist in our 2D domain). It is important to note that the x, y and z axis are not to scale.
Current usage metrics show cumulative count of Article Views (full-text article views including HTML views, PDF and ePub downloads, according to the available data) and Abstracts Views on Vision4Press platform.
Data correspond to usage on the plateform after 2015. The current usage metrics is available 48-96 hours after online publication and is updated daily on week days.
Initial download of the metrics may take a while.