Fig. 8.
Download original image
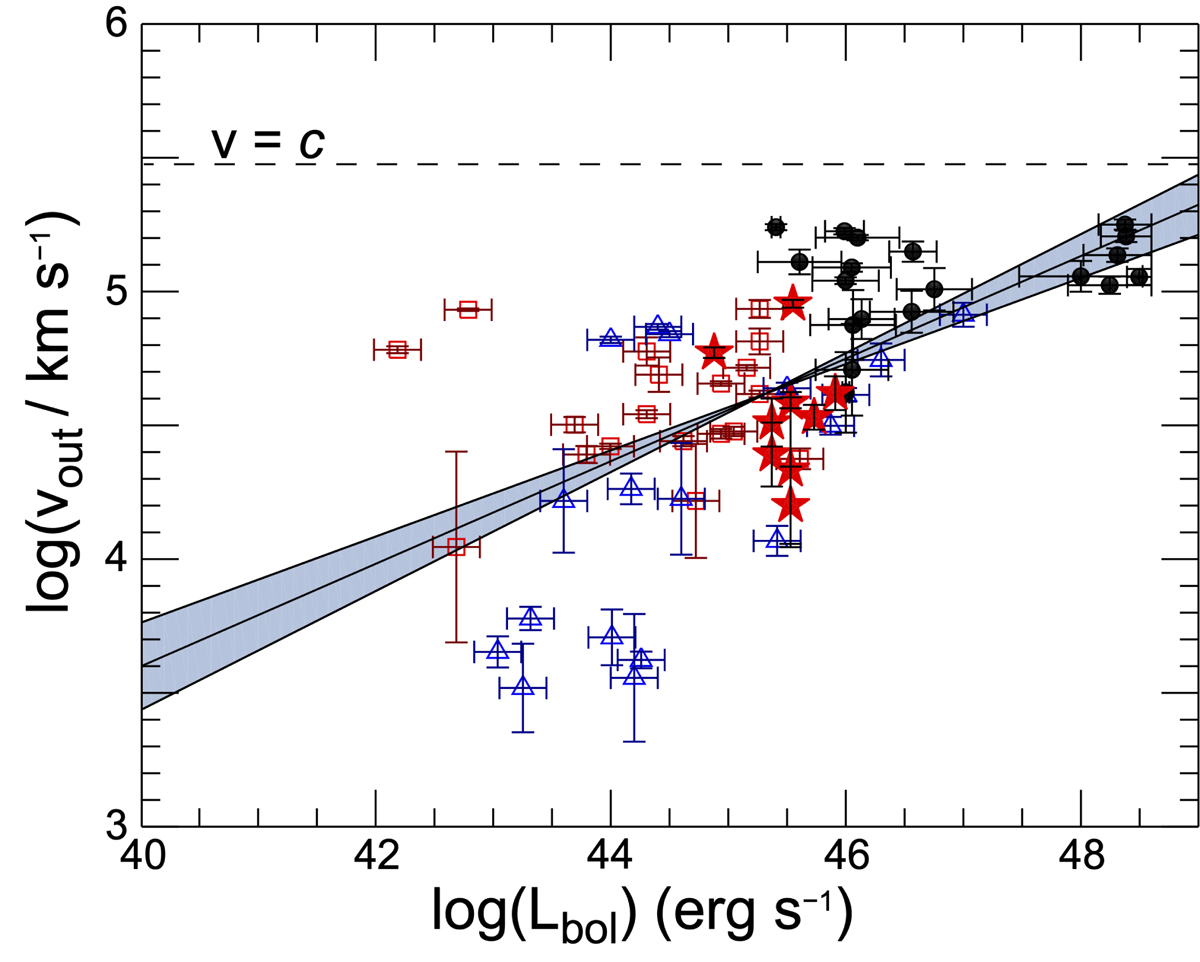
Outflow velocity of the ionised absorber for our SUBWAYS targets (red filled stars) plotted against their bolometric luminosity. Also plotted are the same quantities as derived in the analysis of the low-z AGN samples of Tombesi et al. (2012, red empty squares) and G13 (blue empty triangles) and in the high-z AGN sample of C21 (black filled circles). The power-law least-squares fit to the combined samples (a total of 49 individual objects and 63 observations) is shown with a solid line. The shaded area represents the uncertainty of the slopes of our fits to the data. Here the outflow velocity is simply described as the absolute value of vout.
Current usage metrics show cumulative count of Article Views (full-text article views including HTML views, PDF and ePub downloads, according to the available data) and Abstracts Views on Vision4Press platform.
Data correspond to usage on the plateform after 2015. The current usage metrics is available 48-96 hours after online publication and is updated daily on week days.
Initial download of the metrics may take a while.