Fig. 6.
Download original image
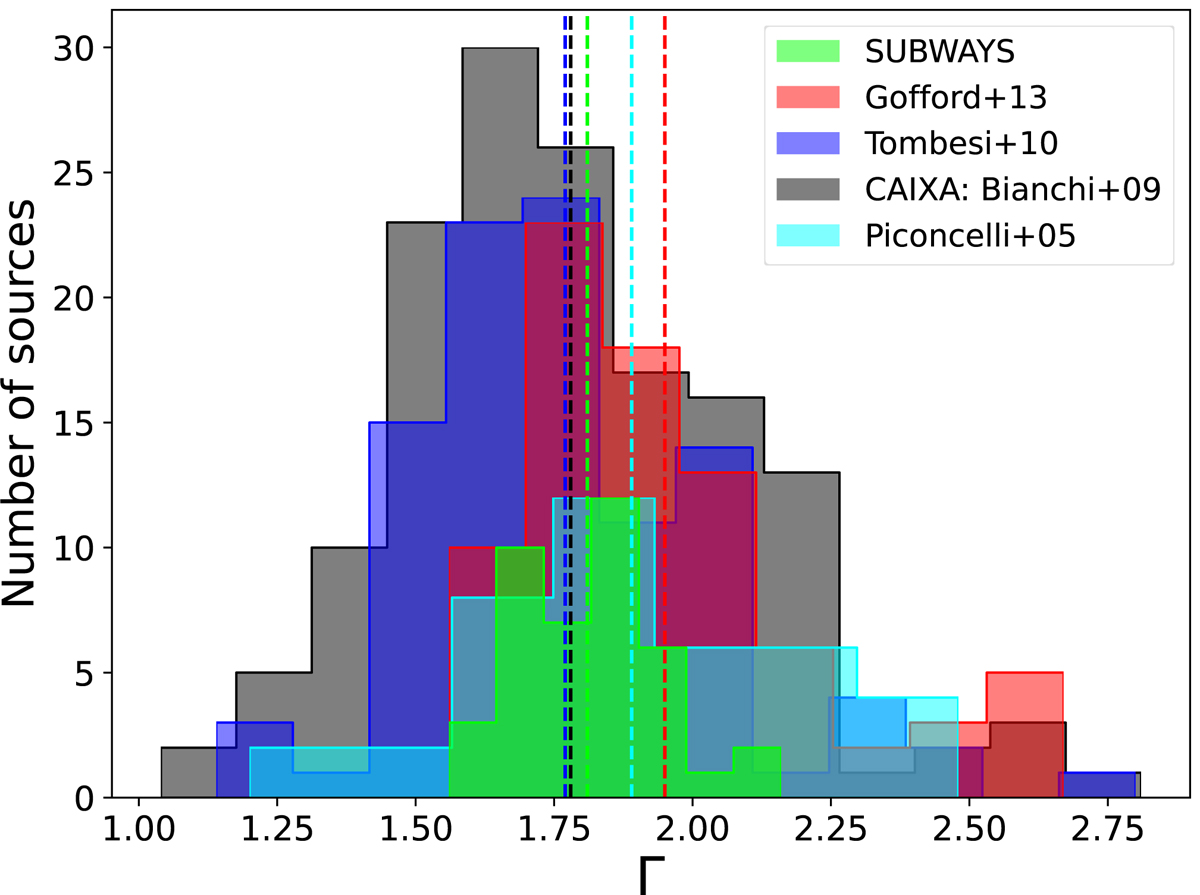
Histogram comparing the photon index (Γ) measured in SUBWAYS (green; this work, with a mean value of ![]() ; vertical line) with those measured in an X-ray-selected sample (CAIXA sample, 150 sources with
; vertical line) with those measured in an X-ray-selected sample (CAIXA sample, 150 sources with ![]() ; Bianchi et al. 2009), the PGQSO sample (Piconcelli et al. 2005, 40 sources
; Bianchi et al. 2009), the PGQSO sample (Piconcelli et al. 2005, 40 sources ![]() ), and local AGNs (T10; G13 with
), and local AGNs (T10; G13 with ![]() and
and ![]() , respectively).
, respectively).
Current usage metrics show cumulative count of Article Views (full-text article views including HTML views, PDF and ePub downloads, according to the available data) and Abstracts Views on Vision4Press platform.
Data correspond to usage on the plateform after 2015. The current usage metrics is available 48-96 hours after online publication and is updated daily on week days.
Initial download of the metrics may take a while.