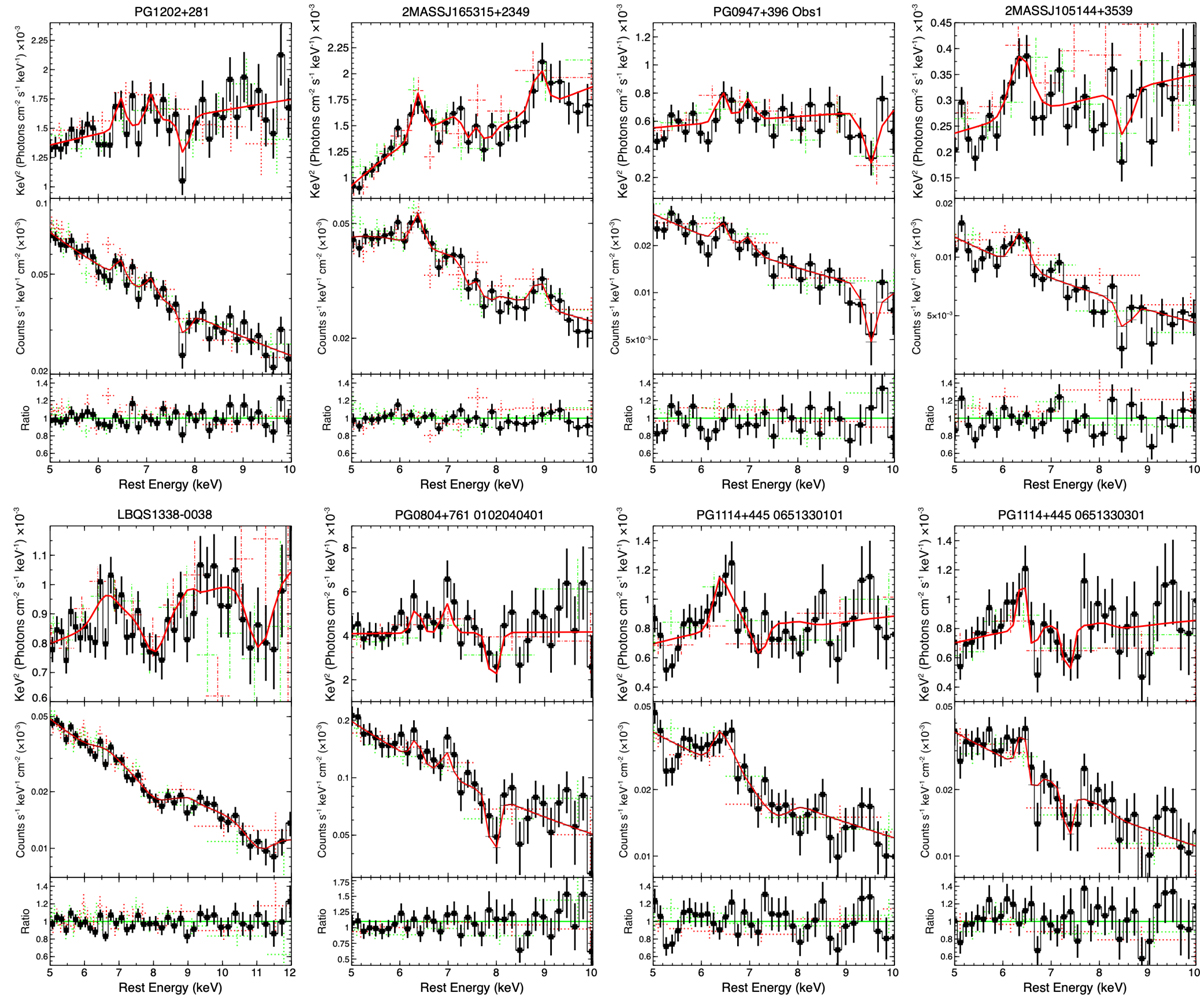
Fig. 5.
Download original image
XMM-Newton EPIC spectra and the corresponding best-fit models focused on the Fe K band. Top: unfolded EPIC-pn (black), EPIC-MOS 1 (dashed red), and EPIC-MOS 2 (dashed green) spectra, between 5–10 keV, of the eight observations where the Fe K absorption line was detected at Pℳ𝒞 ≳ 95%. The spectra were firstly unfolded against a power law of Γ = 2, and their corresponding best-fitting model (solid red) was overlaid afterwards. Middle: corresponding EPIC data counts and best-fitting model. Bottom: data/model ratio. The presumed absorption features at ∼ 9.2 keV and ∼ 9.5 keV present in, for example, 2MASSJ105144+3539 and 2MASS J165315+2349, respectively, are simply not significant enough to be considered as detections (see Figs. 4 and E.1), and hence they were not included in the best-fitting models.
Current usage metrics show cumulative count of Article Views (full-text article views including HTML views, PDF and ePub downloads, according to the available data) and Abstracts Views on Vision4Press platform.
Data correspond to usage on the plateform after 2015. The current usage metrics is available 48-96 hours after online publication and is updated daily on week days.
Initial download of the metrics may take a while.